
Dream Industrial REIT Reports Strong Q4 2022 and Year-End Financial Results
Dream Industrial Real Estate Investment Trust (DIR.UN-TSX) (the “Trust” or “Dream Industrial REIT” or “Dream Industrial” or “we” or “us”) today announced its financial results for the three months and year ended December 31, 2022. Management will host a conference call to discuss the financial results on February 15, 2023 at 1:00 p.m. (ET).
This press release features multimedia. View the full release here: https://www.businesswire.com/news/home/20230214005874/en/
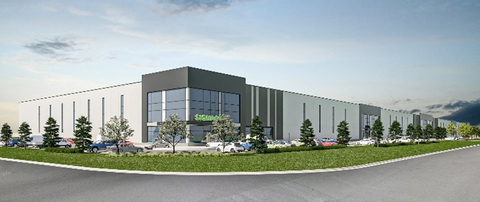
Highlighted Development Projects - Maple Grove, Cambridge, Ontario (Graphic: Business Wire)
HIGHLIGHTS
- Diluted funds from operations (“FFO”) per Unit(1) was $0.89 in 2022, a 9.0% increase when compared to $0.81 in 2021. For the quarter, diluted FFO per Unit was $0.23, a 10.4% increase when compared to Q4 2021;
- Comparative properties net operating income (“CP NOI”) (constant currency basis)(2) was $174.1 million in 2022, a 10.5% increase when compared to $157.6 million in 2021. The Canadian portfolio posted a year-over-year CP NOI (constant currency basis) growth of 11.1%, driven by 14.6%, 12.6% and 6.0% CP NOI (constant currency basis) increases in Ontario, Québec and Western Canada, respectively. The European portfolio saw a 9.2% year-over-year CP NOI (constant currency basis) growth. For the quarter, CP NOI (constant currency basis) was $65.3 million, a 9.6% increase when compared to $59.6 million in Q4 2021, driven by 17.1%, 10.7%, 8.0% and 5.1% CP NOI (constant currency basis) increases in Ontario, Québec, Western Canada and Europe, respectively.
- Net rental income was $281.6 million in 2022, a 29.2% increase when compared to $217.9 million in 2021. Year-over-year net rental income increased by 42.2% in Ontario, 24.9% in Québec, 5.0% in Western Canada and 74.1% in Europe, primarily driven by acquisitions and growth in CP NOI (constant currency basis). For the quarter, net rental income was $75.5 million, a 25.0% increase when compared to $60.4 million in Q4 2021, driven by 45.4% in Ontario, 14.5% in Québec, 8.1% in Western Canada and 25.0% in Europe;
- Net income was $705.9 million in 2022, a 16.0% increase when compared to $608.3 million in 2021, consisting of net rental income of $281.6 million, fair value adjustments to investment properties of $363.0 million, fair value adjustments to financial instruments of $122.5 million and other income and expenses of ($61.2) million. For the quarter, net loss was $34.1 million, a decrease of $224.1 million when compared to $190.0 million in Q4 2021, consisting of net rental income of $75.5 million, fair value adjustments to investment properties of ($65.5) million, fair value adjustments to financial instruments of ($19.9) million and other expenses of $24.2 million;
- Total assets were $7.3 billion as at December 31, 2022, a 20.3% increase when compared to $6.1 billion as at December 31, 2021, driven by acquisitions and higher investment property values;
- Total equity (including LP B Units)(1) and total equity (per consolidated financial statements) was $4.7 billion and $4.5 billion as at December 31, 2022, respectively. This represents a 22.3% and 27.2% increase, respectively, when compared to $3.8 billion and $3.5 billion as at December 31, 2021;
- Net asset value (“NAV”) per Unit(2) was $16.97 as at December 31, 2022, a 12.2% increase when compared to the NAV per Unit of $15.13 as at December 31, 2021, driven by higher investment property values across our portfolio due to continued growth in market rents.
(1) Diluted FFO per Unit is a non-GAAP ratio. For further information on this non-GAAP ratio, please refer to the statements under the heading “Non-GAAP financial measures, ratios and supplementary financial measures” in this press release. |
(2) CP NOI (constant currency basis) is a non-GAAP financial measure. The tables included in the Appendices section of this press release reconcile CP NOI (constant currency basis) for the three months and year ended December 31, 2022 and December 31, 2021 to net rental income. For further information on this non-GAAP financial measure, please refer to the statements under the heading “Non-GAAP financial measures, ratios and supplementary financial measures” in this press release. |
The Trust continues to make significant progress on strategic initiatives to maximize organic growth drivers while maintaining a strong and flexible balance sheet. Highlights include:
- Strong organic growth – Leasing momentum in the Trust’s portfolio continued to remain robust as it continues to maximize rental rate growth across its portfolio. During the quarter, the Trust signed approximately 1.5 million square feet of renewals and new leases across its portfolio, at an average rental spread of 59.5% over prior or expiring rents, excluding two automatic five-year term renewals totalling 0.4 million square feet in the Netherlands. The Trust’s in-place and committed occupancy remained strong at 98.9% as at December 31, 2022, compared to 98.2% as at December 31, 2021. At the end of Q4 2022, estimated market rents across the Trust’s portfolio exceeded the average in-place base rent by over 35%.
- Development pipeline execution – The Trust made significant progress on its development and intensifications pipeline during 2022. During the year, the Trust substantially completed 577,000 square feet of expansions across Canada and Europe, generating an average anticipated unlevered yield on cost of 7.6%. The Trust’s development pipeline totals approximately 3.8 million square feet in land-constrained markets in Canada and Europe.
- Strong and flexible balance sheet – The Trust ended Q4 2022 with total available liquidity(3) of $530 million including cash and cash equivalents of $83.8 million. During the quarter, the Trust upsized its unsecured credit facility by $150 million to $500 million and increased its unsecured term loan by US$100 million to US$250 million. The Trust’s net total debt-to-total-assets (net of cash and cash equivalents) ratio(4) was 31.7% as at December 31, 2022.
- Activating capital recycling opportunities – During Q4 2022, the Trust completed the dispositions of two non-core properties located in the Netherlands for €4 million which represents approximately 8% above the carrying value of the assets as at Q3 2022.
- Adding scale in Canada while significantly increasing fee-generating business – During 2022, the Trust acquired approximately $565 million of income-producing assets (net of transaction costs of $35 million) that have added more than 2.6 million square feet of high-quality logistics space in land-constrained markets across Canada and Europe.
(1) Total equity (including LP B Units) is a non-GAAP financial measure. The tables included in the Appendices section of this press release reconcile total equity (including LP B Units) as at December 31, 2022 and December 31, 2021 to total equity (per consolidated financial statements). For further information on this non-GAAP financial measure, please refer to the statements under the heading “Non-GAAP financial measures, ratios and supplementary financial measures” in this press release. |
(2) NAV per Unit is a non-GAAP ratio. For further information on this non-GAAP ratio, please refer to the statements under the heading “Non-GAAP financial measures, ratios and supplementary financial measures” in this press release. |
(3) Available liquidity is a non-GAAP financial measure. The tables included in the Appendices section of this press release reconcile available liquidity as at December 31, 2022 and December 31, 2021 to cash and cash equivalents. For further information on this non-GAAP financial measure, please refer to the statements under the heading “Non-GAAP financial measures, ratios and supplementary financial measures” in this press release. |
(4) Net total debt-to-total assets (net of cash and cash equivalents) is a non-GAAP ratio. For further information on this non-GAAP ratio, please refer to the statements under the heading “Non-GAAP financial measures, ratios and supplementary financial measures” in this press release. |
On November 7, 2022, the Trust announced, in partnership with GIC, an agreement with Summit Industrial Income REIT under which a joint venture between the Trust and GIC (the “Dream Summit”) will acquire Summit Industrial Income REIT in a transaction valued at approximately $5.9 billion, including the assumption of certain debt (the “Arrangement”). Subsequent to December 31, 2022, regulatory approvals in respect of the Arrangement were received and closing of the Arrangement is expected to occur on or about February 17, 2023, subject to the satisfaction or waiver of all of the remaining customary closing conditions, all of which have been or are expected to be satisfied by or on such date. If all customary closing conditions are met or waived, the Trust will acquire a 10% interest in the joint venture for cash consideration of approximately $473 million, net of debt to be assumed on closing of the Arrangement and including estimated transaction costs. The Arrangement is expected to be funded with proceeds from a new $200 million unsecured term loan, the unsecured revolving credit facility and available cash on hand.
The Trust will provide property management and leasing services to Dream Summit and earn fees at market rates. Moreover, Dream Summit is expected to provide a new source of growth capital for the Trust to pursue strategic acquisitions without reliance on capital market and significantly boost the Trust’s property management and leasing fee stream.
Subsequent to the transaction, the Trust will co-own and manage one of the largest portfolios of industrial assets in Canada with 43 million square feet of high-quality properties, primarily located in the Greater Toronto Area, Greater Golden Horseshoe Area, and Greater Montréal Area. In addition, the Trust will have exposure to over 6.2 million square feet of near-term development projects in Canada (including projects held in the Development JV and in the Dream Summit venture at 100%) with anticipated completion in the next 12–30 months.
Pro forma the Dream Summit venture, the Trust’s total co-owned and managed portfolio will grow to over 70 million square feet of GLA across Canada, U.S. and Europe, with 46% of its co-owned and managed GLA located in Ontario and Québec, up from 33% as at December 31, 2021.
FINANCIAL HIGHLIGHTS
SELECTED FINANCIAL INFORMATION |
|
|
|
|
|
|
|
|
|||
|
Three months ended |
|
Year ended |
||||||||
|
|
December 31, |
|
December 31, |
|
December 31, |
|
December 31, |
|||
(in thousands of dollars except per Unit amounts) |
|
2022 |
|
2021 |
|
2022 |
|
2021 |
|||
Operating results |
|
|
|
|
|
|
|
|
|||
Net rental income |
$ |
75,548 |
$ |
60,432 |
$ |
281,587 |
$ |
217,899 |
|||
CP NOI (constant currency basis)(1) |
|
65,268 |
|
59,574 |
|
174,071 |
|
157,564 |
|||
Net income (loss) |
|
(34,147) |
|
189,971 |
|
705,885 |
|
608,345 |
|||
Funds from operations (“FFO”)(2) |
|
64,033 |
|
52,033 |
|
240,493 |
|
176,616 |
|||
Per Unit amounts |
|
|
|
|
|
|
|
|
|||
FFO – diluted(3)(4) |
$ |
0.23 |
$ |
0.21 |
$ |
0.89 |
$ |
0.81 |
|||
Distribution rate |
|
0.17 |
|
0.17 |
|
0.70 |
|
0.70 |
|||
See footnotes at end. |
|
|
|
|
|
|
|
|
|||
PORTFOLIO INFORMATION |
|
|
|
|
|
|
|
As at |
|||
|
|
December 31, |
|
December 31, |
|
(in thousands of dollars) |
|
2022 |
|
2021 |
|
Total portfolio |
|
|
|
|
|
Number of assets(5)(6) |
257 |
|
239 |
||
Investment properties fair value |
$ |
6,759,425 |
$ |
5,696,607 |
|
Gross leasable area (“GLA”) (in millions of sq. ft.)(6) |
|
47.3 |
|
43.0 |
|
Occupancy rate – in-place and committed (period-end)(7) |
|
98.9% |
|
98.2% |
|
Occupancy rate – in-place (period-end)(7) |
|
97.9% |
|
97.7% |
|
See footnotes at end. |
|
|
|
|
|
FINANCING AND CAPITAL INFORMATION |
|
|
|
|
||
(unaudited) |
|
As at |
||||
|
|
December 31, |
|
December 31, |
||
(in thousands of dollars except per Unit amounts) |
|
2022 |
|
2021 |
||
FINANCING |
|
|
|
|
||
Credit rating- DBRS |
|
BBB (mid) |
|
BBB (mid) |
||
Net total debt-to-total assets (net of cash and cash equivalents) ratio(8) |
|
31.7% |
|
31.6% |
||
Net total debt-to-normalized adjusted EBITDAFV ratio (years)(9) |
|
8.3 |
|
8.0 |
||
Interest coverage ratio (times)(10) |
|
12.3 |
|
7.9 |
||
Weighted average face interest rate on debt |
|
1.21% |
|
0.83% |
||
Weighted average remaining term to maturity on debt (years) |
|
3.0 |
|
3.8 |
||
Unencumbered investment properties(11) |
$ |
5,313,083 |
$ |
4,154,925 |
||
Total assets |
$ |
7,280,493 |
$ |
6,053,566 |
||
Cash and cash equivalents |
$ |
83,802 |
$ |
164,015 |
||
Available liquidity (period-end)(12) |
$ |
529,587 |
$ |
511,612 |
||
CAPITAL |
|
|
|
|
||
Total equity (excluding LP B Units) |
$ |
4,452,741 |
$ |
3,499,423 |
||
Total equity (including LP B Units)(13) |
$ |
4,669,612 |
$ |
3,818,886 |
||
Total number of Units (in thousands)(14) |
|
275,156 |
|
252,417 |
||
Net asset value (“NAV”) per Unit(15) |
$ |
16.97 |
$ |
15.13 |
||
Unit price |
$ |
11.69 |
$ |
17.22 |
||
See footnotes at end. |
|
|
|
|
||
“2022 was another successful year for Dream Industrial,” said Brian Pauls, Chief Executive Officer of Dream Industrial REIT. “Notwithstanding many macroeconomic headwinds, we were able to outperform our goals and targets in 2022. We delivered over 10% of comparative properties NOI growth and 9% FFO per Unit growth which represent the strongest year of results for the Trust. Industrial fundamentals remain strong as we continue to see robust demand for high-quality industrial assets, low availability rates, and increasing rents across all our markets which support our positive outlook for organic growth in 2023. Our strategic initiatives have led to several drivers of cash flow and NAV growth, including a robust organic growth profile for our assets, an accretive development pipeline, a growing fee revenue stream, and a full slate of sustainability initiatives, while preserving balance sheet quality and flexibility. With completed developments coming on line and a much larger platform via our partnership with private capital, Dream Industrial is well-positioned with better opportunities for synergies with tenants and for growing cash flow and overall returns to unitholders.”
ORGANIC GROWTH
-
Robust leasing momentum at attractive rental spreads and solid contractual rent growth – Since the end of Q3 2022, the Trust has signed approximately 1.5 million square feet of new leases and renewals at an average spread of 59.5% over prior or expiring rents, excluding two automatic five-year term renewals totalling 0.4 million square feet in the Netherlands. The future rents on these two renewals will be subject to consumer price index (“CPI”) indexation upon commencement of the renewal terms.
Highlights of the Trust’s recent leasing highlights are below:
- The Trust addressed the remaining 130,000 square feet of its 600,000 square foot vacancy in its property in Blois, France. The Trust achieved a 7% spread to the prior rent with the lease fully indexed to CPI, which commenced in November 2022.
- In Ontario, the Trust signed 270,000 square feet of renewals, achieving an average spread to expiry above 75% and an annual contractual rent growth above 3%.
- In Québec, the Trust signed two renewals for a combined 130,000 square feet space while achieving a 201% spread compared to the prior rent.
The Trust expects to achieve strong rental rate growth over time as it sets rents on expiring leases to market, as market rents continue to increase across the Trust’s operating markets. As at December 31, 2022, the estimated market rent of properties in the Trust’s portfolio increased by nearly 25% compared to December 31, 2021, and over 8% compared to September 30, 2022. As at December 31, 2022, estimated market rents exceed the average in-place base rent across the Trust’s portfolio by over 35%.
-
Solid pace of CP NOI (constant currency basis)(1) growth – CP NOI (constant currency basis) for the three months and year ended December 31, 2022 was $65.3 million and $174.1 million, respectively. For the same comparative periods in 2021, CP NOI (constant currency basis) was $59.6 million and $157.6 million, respectively. This represents an increase of 9.6% and 10.5% for the three months and year ended December 31, 2022, respectively, compared to the prior year comparative periods.
The growth in CP NOI (constant currency basis) was led by a 17.1% and 14.6% year-over-year increase in CP NOI in Ontario for the three months and year ended December 2022, respectively. This was driven primarily by increasing rental spreads on new and renewed leases where the average in-place base rent increased by 12.3% and 10.0%, respectively, along with a 160 and 180 basis points increase in average occupancy, respectively, for the three months and year ended December 31, 2022.
In Québec, year-over-year CP NOI (constant currency basis) growth was 10.7% and 12.6% for the three months and year ended December 31, 2022, respectively. Higher rental rates on new and renewed leases and contractual rent step-ups resulted in an overall increase in average in-place rent by 6.7% and 7.6% for the three months and year ended December 31, 2022, respectively.
In Europe, strong contractual rent growth and CPI indexation resulted in a 2.0% and 4.8% increase in in-place base rent for the three months and year ended December 31, 2022, which drove year-over-year CP NOI (constant currency basis) growth of 5.1% and 9.2% for the three months and year ended December 31, 2022, respectively. The increase was driven by higher rental rates and the impact of CPI indexation on leases. For the quarter, CPI indexation contributed approximately 3.8% increase in comparative properties NOI and 3.4% year-to-date. Additionally, $0.1 million of solar income was recognized in CP NOI (constant currency basis) during the quarter from completed projects in the Netherlands, bringing the total solar income for the year to $0.6 million.
“2022 was a strong year for Dream Industrial and displayed the strength of organic growth that could be produced by our portfolio,” said Alexander Sannikov, Chief Operating Officer of Dream Industrial REIT. “We are seeing strong industrial fundamentals across all of our markets. In Europe, the macroeconomic sentiment has improved considerably over the course of the year and our leasing momentum has continued to be robust, resulting in occupancy of over 99% and CP NOI growth of over 9% for 2022. In Canada, we continue to see strong rental growth in Ontario and Québec and accelerating pace of rental growth in Western Canada. Overall, we maintain a positive outlook for the organic growth prospects of our business.”
- In-place and committed occupancy – The Trust’s in-place and committed occupancy remained strong at 98.9%, compared to 98.2% as at December 31, 2021. The Trust has 9.2% of its portfolio GLA maturing in 2023, including over 2 million square feet in Ontario and Montréal, providing the Trust with significant opportunities to capture rent increases in these markets.
- Net rental income for the quarter and year-to-date – Net rental income for the three months and year ended December 31, 2022 was $75.5 million and $281.6 million, respectively, representing an increase of $15.1 million or 25.0%, and $63.7 million or 29.2%, respectively, relative to the prior year comparative periods. For the three months ended December 31, 2022, year-over-year net rental income increased by 45.4% in Ontario, 14.5% in Québec, 8.1% in Western Canada and 25.0% in Europe. The increase was mainly driven by strong comparative properties NOI (constant currency basis) growth in 2022 and the impact of acquired investment properties in 2022 and 2021.
DEVELOPMENT UPDATE
The Trust’s development pipeline provides a significant opportunity to add high-quality assets in core markets at attractive economics to the Trust. The Trust has approximately 3.8 million square feet of development projects that are currently underway or in planning stages.
The Trust currently has 961,000 square feet of projects underway across Canada. With a total expected cost of approximately $218 million (estimated costs to completion of $111 million), the Trust expects unlevered yield on development cost of approximately 6.6% upon completion. The Trust expects these projects to be completed in the next 12–18 months.
- During the quarter, the Trust commenced construction at a 436,000 square foot ground-up development in Cambridge, Ontario. This project is part of the Trust’s $1.5 billion develop-to-hold joint venture with a sovereign wealth fund, in which the Trust owns a 25% share. The project is expected to be completed in the next 12 months with a forecast unlevered yield on cost of above 6.6%.
- The Trust is under construction on the redevelopment of three buildings in Mississauga with an existing site area of 10 acres, providing opportunity to build a high-quality logistics product totalling 209,000 square feet. The building is expected to be Net Zero ready at completion and is expected to be one of only a handful such warehouses in Canada. Construction completion is expected by early 2024 with an estimated unlevered yield on cost of 6.3%.
- The Trust advanced the greenfield development of the 20-acre parcel of land located in the Balzac sub-market of Calgary, close to the Calgary International Airport with excellent connectivity to major highways and downtown Calgary. Construction commenced with an anticipated completion by the end of 2023 and an estimated unlevered yield on cost of 6.1%.
The Trust has an additional 1.4 million square feet of projects at its share that are in the final stages of planning with targeted completion in the coming two to three years. With a total cost of approximately $303 million, the Trust expects an average unlevered yield on cost of approximately 6.1%.
In addition to the above projects, the Trust is in the preliminary stages of planning for approximately 0.9 million square feet of near-term expansion and redevelopment opportunities in Europe.
Highlighted development projects See Figure 1, Highlighted Development Projects - Maple Grove, Cambridge, Ontario
CAPITAL STRATEGY
The Trust continues to maintain significant financial flexibility as it executes on its strategy to grow and upgrade portfolio quality. The Trust’s proportion of secured debt(16) is 7.3% of total assets and represents approximately 23% of total debt(17), compared to 27.9% one year ago. Additionally, the Trust’s unencumbered asset pool totalled $5.3 billion as at December 31, 2022, representing approximately 78.6% of the Trust’s investment properties value as at December 31, 2022.
The Trust ended Q4 2022 with total available liquidity(12) of $529.6 million including cash and cash equivalents of $83.8 million. During the quarter, the Trust enhanced its liquidity with the $150 million upsize of its unsecured credit facility to $500 million with an additional $250 million accordion and the extension of the maturity to 2026. The Trust also increased is unsecured term loan by US$100 million to US$250 million and extended the term to late 2025.
“Our focus on maintaining a strong and flexible balance sheet has allowed us to execute on several strategic initiatives,” said Lenis Quan, Chief Financial Officer of Dream Industrial REIT. “Pro forma the closing of the acquisition of Summit Industrial Income REIT, we would have successfully deployed capital to bring leverage to our targeted range in the mid 30%, with over $500 million of liquidity including the accordion. We have limited debt maturing in the near-term, which along with a solid outlook for organic growth have positioned us to continue to drive robust FFO per unit growth.”
CONFERENCE CALL
Senior management will host a conference call to discuss the financial results on Wednesday, February 15, 2023, at 1:00 p.m. (ET). To access the conference call, please register at https://register.vevent.com/register/BI5f5b530163fc4e88a2bf7f7ab33b3a8f. To access the conference call via webcast, please go to Dream Industrial REIT’s website at www.dreamindustrialreit.ca and click on the link for News, then click on Events. A taped replay of the conference call and the webcast will be available for ninety (90) days following the call.
OTHER INFORMATION
Information appearing in this press release is a select summary of financial results. The consolidated financial statements and management’s discussion and analysis for the Trust will be available at www.dreamindustrialreit.ca and on www.sedar.com.
Dream Industrial REIT is an unincorporated, open-ended real estate investment trust. As at December 31, 2022, Dream Industrial REIT owns, manages and operates a portfolio of 257 industrial assets totalling approximately 47.3 million square feet of gross leasable area in key markets across Canada, Europe, and the U.S. Dream Industrial REIT’s goal is to deliver strong total returns to its unitholders through secure cash flows underpinned by its high-quality portfolio and an investment grade balance sheet as well as driving growth in its net asset value and cash flow per unit. For more information, please visit www.dreamindustrialreit.ca.
FOOTNOTES
- CP NOI (constant currency basis) is a non-GAAP financial measure. The most directly comparable financial measure to CP NOI (constant currency basis) is net rental income. The table included in the Appendices section of this press release reconcile CP NOI (constant currency basis) for the three months and year ended December 31, 2022 and December 31, 2021 to net rental income. For further information on this non-GAAP measure, please refer to the statements under the heading “Non-GAAP financial measures, ratios and supplementary financial measures” in this press release.
- FFO is a non-GAAP financial measure. The most directly comparable financial measure to FFO is net income (loss). The tables included in the Appendices section of this press release reconcile FFO for the three months and year ended December 31, 2022 and December 31, 2021 to net income (loss). For further information on this non-GAAP measure, please refer to the statements under the heading “Non-GAAP financial measures, ratios and supplementary financial measures” in this press release.
- Diluted FFO per Unit is a non-GAAP ratio. Diluted FFO per Unit is comprised of FFO (a non-GAAP financial measure) divided by the weighted average number of Units. For further information on this non-GAAP ratio, please refer to the statements under the heading “Non-GAAP financial measures, ratios and supplementary financial measures” in this press release.
- A description of the determination of diluted amounts per Unit can be found in the Trust’s Management’s Discussion and Analysis for the three months and year ended December 31, 2022, in the section “Supplementary financial measures and ratios and other disclosures”, under the heading “Weighted average number of Units”.
- “Number of assets” comprise a building, or a cluster of buildings in close proximity to one another, attracting similar tenants.
- Includes the Trust’s owned and managed properties as at December 31, 2022 and December 31, 2021.
- Includes the Trust's share of equity accounted investments as at December 31, 2022 and December 31, 2021. In addition, includes the expanded space related to the completed expansion in Dresden, Germany as at December 31, 2022, which has been 100% leased for occupancy in January 2023.
- Net total debt-to-total assets (net of cash and cash equivalents) ratio is a non-GAAP ratio. Net total debt-to-total assets (net of cash and cash equivalents) ratio is comprised of net total debt (a non-GAAP financial measure) divided by total assets (net of cash and cash equivalents) (a non-GAAP financial measure). The most directly comparable IFRS financial measure to net total debt is non-current debt, and the most directly comparable IFRS financial measure to total assets (net of cash and cash equivalents) is total assets. For further information on this non-GAAP ratio and these non-GAAP financial measures, please refer to the statements under the heading “Non-GAAP financial measures, ratios and supplementary financial measures” in this press release.
- Net total debt-to-normalized adjusted EBITDAFV is a non-GAAP ratio. Net total debt-to-normalized adjusted EBITDAFV is comprised of net total debt (a non-GAAP financial measure) divided by normalized adjusted EBITDAFV (a non-GAAP financial measure). The most directly comparable IFRS financial measure to normalized adjusted EBITDAFV is net income (loss). For further information on this non-GAAP ratio and this non-GAAP financial measure, please refer to the statements under the heading “Non-GAAP financial measures and ratios and supplementary financial measures” in this press release.
- Interest coverage ratio is a non-GAAP ratio. Interest coverage ratio is comprised of trailing 12-month period adjusted EBITDAFV (a non-GAAP financial measure) divided by trailing 12-month period interest expense on debt and other financing costs. The most directly comparable IFRS financial measure to adjusted EBITDAFV is net income (loss). For further information on this non-GAAP ratio and non-GAAP financial measure, please refer to the statements under the heading “Non-GAAP financial measures and ratios and supplementary financial measures” in this press release.
- Unencumbered investment properties is a supplementary financial measure. For further information on this supplementary financial measure, please refer to the statements under the heading “Non-GAAP financial measures, ratios and supplementary financial measures” in this press release.
- Available liquidity is a non-GAAP financial measure. The most directly comparable financial measure to available liquidity is cash and cash equivalents. The tables included in the Appendices section of this press release reconcile available liquidity to cash and cash equivalents as at December 31, 2022 and December 31, 2021. For further information on this non-GAAP financial measure, please refer to the statements under the heading “Non-GAAP financial measures, ratios and supplementary financial measures” in this press release.
- Total equity (including LP B Units or subsidiary redeemable units) is a non-GAAP financial measure. The most directly comparable financial measure to total equity (including LP B Units) is total equity (per consolidated financial statements). The tables included in the Appendices section of this press release reconcile total equity (including LP B Units) to total equity (per consolidated financial statements) as at December 31, 2022 and December 31, 2021. For further information on this non-GAAP measure, please refer to the statements under the heading “Non-GAAP financial measures, ratios and supplementary financial measures” in this press release.
- Total number of Units includes 18.6 million LP B Units that are classified as a liability under IFRS.
- NAV per Unit is a non-GAAP ratio. NAV per Unit is comprised of total equity (including LP B Units) (a non-GAAP financial measure) divided by the total number of Units. For further information on this non-GAAP ratio, please refer to the statements under the heading “Non-GAAP financial measures, ratios and supplementary financial measures” in this press release.
- Secured debt is a supplementary financial measure. Please refer to the statements under the heading “Non-GAAP financial measures, ratios and supplementary financial measures” in this press release.
- Total debt is a non-GAAP financial measure. The most directly comparable financial measure to total debt is non-current debt. The tables included in the Appendices section of this press release reconcile total debt to non-current debt as at December 31, 2022 and December 31, 2021. For further information on this non-GAAP financial measure, please refer to the statements under the heading “Non-GAAP financial measures, ratios and supplementary financial measures” in this press release.
Non-GAAP financial measures, ratios and supplementary financial measures
The Trust’s condensed consolidated financial statements are prepared in accordance with International Financial Reporting Standards (“IFRS”). In this press release, as a complement to results provided in accordance with IFRS, the Trust discloses and discusses certain non-GAAP financial measures and ratios, including FFO, diluted FFO per Unit, CP NOI (constant currency basis), total debt, net total debt-to-total assets (net of cash and cash equivalents) ratio, net total debt, total assets (net of cash and cash equivalents, net total debt-to-normalized adjusted EBITDAFV ratio, adjusted EBITDAFV, normalized adjusted EBITDAFV – annualized, interest coverage ratio, available liquidity, total equity (including LP B Units) and NAV per Unit as well as other measures discussed elsewhere in this press release. These non-GAAP financial measures and ratios are not defined by IFRS and do not have a standardized meaning under IFRS. The Trust’s method of calculating these non-GAAP financial measures and ratios may differ from other issuers and may not be comparable with similar measures presented by other issuers. The Trust has presented such non-GAAP financial measures and ratios as Management believes they are relevant measures of the Trust’s underlying operating and financial performance. Certain additional disclosures such as the composition, usefulness and changes, as applicable, of the non-GAAP financial measures and ratios included in this press release have been incorporated by reference from the management’s discussion and analysis of the financial condition and results from operations of the REIT for the three months and year ended December 31, 2022, dated February 14, 2023 (the “MD&A for the fourth quarter of 2022”) and can be found under the sections “Non-GAAP Financial Measures" and "Non-GAAP Ratios” and respective sub-headings labelled “Funds from operations (“FFO”)”, "Diluted FFO per Unit", "Comparative properties net operating income (“CP NOI”) (constant currency basis)”, “Net total debt-to-total assets (net of cash and cash equivalents) ratio”, “Net total debt-to-normalized adjusted EBITDAFV ratio (years)”, and “Interest coverage ratio”, “Available Liquidity”, "Total equity (including LP B Units or subsidiary redeemable units"), “Total debt”, “Net asset value (“NAV”) per Unit”, “Net total debt and total assets (net of cash and cash equivalents)”, “Adjusted earnings before interest, taxes, depreciation, amortization and fair value adjustments (“Adjusted EBITDAFV”) and Normalized adjusted EBITDAFV – Annualized”. The composition of supplementary financial measures included in this press release have been incorporated by reference from the MD&A for the fourth quarter of 2022 and can be found under the section “Supplementary financial measures and ratios and other disclosures”. The MD&A for the fourth quarter of 2022 is available on SEDAR at www.sedar.com under the Trust’s profile and on the Trust’s website at www.dreamindustrialreit.ca under the Investors section. Non-GAAP financial measures and ratios should not be considered as alternatives to net income, net rental income, cash flows generated from (utilized in) operating activities, cash and cash equivalents, total assets, non-current debt, total equity, or comparable metrics determined in accordance with IFRS as indicators of the Trust’s performance, liquidity, cash flow, and profitability.
Forward looking information
This press release may contain forward-looking information within the meaning of applicable securities legislation, including statements regarding the Trust’s objectives and strategies to achieve those objectives; the expected closing of the acquisition of Summit Industrial Income Real Estate Investment Trust by a joint venture between the Trust and GIC, and expectations regarding the Trust’s provision of certain services to such joint venture and related fees, and expected total managed square feet of industrial space following such acquisition; the Trust’s expectations relating to the benefits to be realized from demand drivers for industrial space, including market rent increases; the resilience of organic growth drivers; the expected growth of the Trust’s property management and leasing business and the expectation that they will be a material and growing driver of FFO growth; the Trust’s portfolio and management strategy and expected benefits to be derived thereof, including the Trust’s ability to execute on its strategy and expected growth opportunities and drivers; our focus on growing organic cash flows; expectations regarding the quality of the Trust’s portfolio and the Trust’s strategy to upgrade portfolio quality; the Trust’s conservative financial policies and expected strength and flexibility of its balance sheet; the Trust’s objective of and expected ability to provide attractive overall returns and long term value to unitholders; the value to be derived from intensification of the Trust’s portfolio; expectations regarding our ability to partner with private capital to grow our portfolio and diversify our capital sources; the Trust being positioned as a top industrial platform in Canada; the Trust’s ability to improve the value of its business; the Trust’s ability and expectations to achieve strong rental growth over time as it sets rents on expiring leases to market; our development and intensification pipelines; the expectation that our development pipeline is an accretive driver of cash flow and NAV growth; the achievement of strong rental rate growth as the Trust sets rents on expiring leases to market; CP NOI growth; expected occupancy; the Trust’s mid-30% range leverage target; the Trust’s ability to add high-quality assets in core markets at attractive economics; the Trust’s development, expansion and redevelopment plans, including the timing of construction and expansion, costs, square footage, unlevered yields and anticipated yields; our net zero development projects; and similar statements concerning anticipated future events, financials, future leasing activity, including those associated with user demand relative to supply of quality industrial product in the Trust’s operating markets, the ability to lease vacant space, results of operations, performance, business prospects and opportunities, and the real estate industry in general.
Forward-looking information is based on a number of assumptions and is subject to a number of risks and uncertainties, many of which are beyond the Trust’s control, which could cause actual results to differ materially from those that are disclosed in or implied by such forward-looking information. These risks and uncertainties include, but are not limited to, general and local economic and business conditions; employment levels; mortgage and interest rates and regulations; inflation; risks related to a potential economic slowdown in certain of the jurisdictions in which we operate and the effect inflation and any such economic slowdown may have on market conditions and lease rates; uncertainties around the timing and amount of future financings; uncertainties surrounding the COVID-19 pandemic and other public health crises and epidemics; geopolitical events, including disputes between nations, war and international sanctions; the financial condition of tenants; leasing risks, including those associated with the ability to lease vacant space; rental rates and the strength of rental rate growth on future leasing; and interest and currency rate fluctuations. The Trust’s objectives and forward-looking statements are based on certain assumptions, including that the general economy remains stable; inflation and interest rates will not materially increase beyond current market expectations; conditions within the real estate market remain consistent; competition for acquisitions remains consistent with the current climate; and the capital markets continue to provide ready access to equity and/or debt. All forward-looking information in this press release speaks as of the date of this press release. The Trust does not undertake to update any such forward-looking information whether as a result of new information, future events or otherwise except as required by law. Additional information about these assumptions and risks and uncertainties is contained in the Trust’s filings with securities regulators, including its latest annual information form and MD&A. These filings are also available at the Trust’s website at www.dreamindustrialreit.ca.
Appendices
Reconciliation of CP NOI (constant currency basis) to net rental income
The tables below reconciles CP NOI (constant currency basis) for the three months and year ended December 31, 2022 and December 31, 2021 to net rental income.
|
Three months ended |
||||
|
December 31, |
December 31, |
|||
|
|
2022 |
|
2021 |
|
Ontario |
$ |
16,477 |
$ |
14,074 |
|
Québec |
|
12,178 |
|
10,997 |
|
Western Canada |
|
11,874 |
|
10,994 |
|
Canadian portfolio |
|
40,529 |
|
36,065 |
|
European portfolio (constant currency basis) |
|
21,809 |
|
20,756 |
|
U.S. portfolio (constant currency basis) |
|
2,930 |
|
2,753 |
|
Comparative properties NOI (constant currency basis) |
|
65,268 |
|
59,574 |
|
Impact of foreign currency translation on comparative properties NOI |
|
— |
|
602 |
|
NOI from acquired properties – Canada |
|
4,738 |
|
388 |
|
NOI from acquired properties - Europe |
|
6,514 |
|
705 |
|
NOI from acquired properties – U.S. |
|
888 |
|
38 |
|
NOI from disposed properties |
|
99 |
|
550 |
|
Net property management and other income |
|
729 |
|
237 |
|
Straight-line rent |
|
2,699 |
|
1,299 |
|
Amortization of lease incentives |
|
(1,321) |
|
(497) |
|
Lease termination fees and other |
|
436 |
|
(178) |
|
Bad debt provisions |
|
(442) |
|
(63) |
|
NOI from properties transferred to properties held for development |
|
— |
|
443 |
|
Less: NOI from equity accounted investment |
|
(4,060) |
|
(2,666) |
|
Net rental income from continuing operations |
$ |
75,548 |
$ |
60,432 |
|
|
Year ended |
||||
|
December 31, |
December 31, |
|||
|
|
2022 |
|
2021 |
|
Ontario |
$ |
58,359 |
$ |
50,934 |
|
Québec |
|
33,102 |
|
29,408 |
|
Western Canada |
|
45,965 |
|
43,344 |
|
Canadian portfolio |
|
137,426 |
|
123,686 |
|
U.S. portfolio (constant currency basis) |
|
9,844 |
|
9,333 |
|
European portfolio (constant currency basis) |
|
26,801 |
|
24,545 |
|
Comparative properties NOI (constant currency basis) |
|
174,071 |
|
157,564 |
|
Impact of foreign currency translation on comparative properties NOI |
|
— |
|
1,763 |
|
NOI from acquired properties – Canada |
|
30,778 |
|
10,696 |
|
NOI from acquired properties – Europe |
|
78,839 |
|
32,840 |
|
NOI from acquired properties – U.S. |
|
3,455 |
|
1,030 |
|
NOI from disposed properties |
|
360 |
|
19,905 |
|
Net property management and other income |
|
3,594 |
|
554 |
|
Straight-line rent |
|
7,558 |
|
3,118 |
|
Amortization of lease incentives |
|
(3,073) |
|
(1,831) |
|
Lease termination fees and other |
|
(54) |
|
1,101 |
|
Bad debt provisions |
|
(1,063) |
|
(169) |
|
NOI from properties transferred to properties held for development |
|
1,256 |
|
1,577 |
|
Less: NOI from equity accounted investment |
|
(14,134) |
|
(10,249) |
|
Net rental income from continuing operations |
$ |
281,587 |
$ |
217,899 |
|
Appendices
Reconciliation of FFO to net income (loss)
The table below reconciles FFO for the three months and year ended December 31, 2022 and December 31, 2021 to net income (loss).
|
Three months ended December 31, |
|
Year ended December 31, |
||||||||
|
|
2022 |
|
2021 |
|
|
2022 |
|
2021 |
||
Net income (loss) for the period |
$ |
(34,147) |
$ |
189,971 |
|
$ |
705,885 |
$ |
608,345 |
||
Add (deduct): |
|
|
|
|
|
|
|
|
|
||
Fair value adjustments to investment properties |
|
65,503 |
|
(141,841) |
|
|
(363,025) |
|
(586,011) |
||
Fair value adjustments to financial instruments |
|
19,852 |
|
18,818 |
|
|
(122,532) |
|
111,723 |
||
Share of net income from equity accounted investments |
|
9,222 |
|
(26,239) |
|
|
(38,482) |
|
(39,270) |
||
Interest expense on subsidiary redeemable units |
|
3,247 |
|
3,247 |
|
|
12,986 |
|
12,986 |
||
Amortization and write-off of lease incentives |
|
1,335 |
|
498 |
|
|
3,078 |
|
1,807 |
||
Internal leasing costs |
|
908 |
|
1,022 |
|
|
4,128 |
|
3,683 |
||
Fair value adjustments to deferred trust units included in G&A |
|
(173) |
|
155 |
|
|
(223) |
|
357 |
||
Foreign exchange loss (gain) |
|
7,835 |
|
(4,001) |
|
|
11,817 |
|
(2,093) |
||
Share of FFO from equity accounted investments |
|
2,836 |
|
1,502 |
|
|
10,126 |
|
3,066 |
||
Deferred income tax expense (recovery) |
|
(12,471) |
|
9,232 |
|
|
16,043 |
|
12,133 |
||
Current income tax expense related to dispositions |
|
6 |
|
273 |
|
|
132 |
|
16,862 |
||
Transaction costs on sale of investment properties |
|
80 |
|
303 |
|
|
560 |
|
2,366 |
||
Derecognition of equity accounted investment |
|
— |
|
(907) |
|
|
— |
|
(907) |
||
FFO for the period before the undernoted adjustment |
|
64,033 |
|
52,033 |
|
|
240,493 |
|
145,047 |
||
Debt settlement costs |
|
— |
|
— |
|
|
— |
|
31,569 |
||
FFO for the period |
$ |
64,033 |
$ |
52,033 |
|
$ |
240,493 |
$ |
176,616 |
||
Reconciliation of available liquidity to cash and cash equivalents
The table below reconciles available liquidity to cash and cash equivalents as at December 31, 2022 and December 31, 2021.
Amounts per consolidated financial statements |
December 31, 2022 |
December 31, 2021 |
|||
Cash and cash equivalents |
$ |
83,802 |
$ |
164,015 |
|
Undrawn unsecured revolving credit facility(1) |
|
445,785 |
|
347,597 |
|
Available liquidity |
$ |
529,587 |
$ |
511,612 |
|
(1) |
Net of letters of credit totalling $2,414 and $2,403 as at December 31, 2022 and December 31, 2021, respectively. |
Reconciliation of total equity (including LP B Units) to total equity (excluding LP B Units)
The table below reconciles total equity (including LP B Units) to total equity (excluding LP B Units) as at December 31, 2022 and December 31, 2021.
|
As at |
||||||||
|
December 31, 2022 |
|
December 31, 2021 |
||||||
|
Number of Units |
|
Amount |
|
Number of Units |
|
Amount |
||
REIT Units and unitholders’ equity |
256,604,207 |
$ |
3,106,904 |
|
233,864,845 |
$ |
2,756,156 |
||
Retained earnings |
— |
|
1,274,974 |
|
— |
|
746,848 |
||
Accumulated other comprehensive income (loss) |
— |
|
70,863 |
|
— |
|
(3,581) |
||
Total equity per consolidated financial statements |
256,604,207 |
|
4,452,741 |
|
233,864,845 |
|
3,499,423 |
||
Add: LP B Units |
18,551,855 |
|
216,871 |
|
18,551,855 |
|
319,463 |
||
Total equity (including LP B Units) |
275,156,062 |
$ |
4,669,612 |
|
252,416,700 |
$ |
3,818,886 |
||
Reconciliation of total debt to non-current debt
The table below reconciles total debt to non-current debt as at December 31, 2022 and December 31, 2021.
Amounts per consolidated financial statements |
December 31, 2022 |
December 31, 2021 |
|||
Non-current debt |
$ |
2,137,412 |
$ |
2,006,647 |
|
Current debt |
|
275,536 |
|
38,349 |
|
Fair value of cross-currency interest rate swaps(1) |
|
(75,581) |
|
(32,514) |
|
Total debt |
$ |
2,337,367 |
$ |
2,012,482 |
|
(1) |
As at December 31, 2022, the cross-currency interest rate swaps were in a net asset position and $76,593 was included in “Derivatives and other non-current assets” and ($1,012) in “Derivatives and other non-current liabilities” in the consolidated financial statements (December 31, 2021 – the CCIRS were in a net asset position and $38,939 was included in “Derivatives and other non-current assets” and ($6,425) in “Derivatives and other non-current liabilities” in the consolidated financial statements). |
View source version on businesswire.com: https://www.businesswire.com/news/home/20230214005874/en/
Dream Industrial REIT
Brian Pauls
Chief Executive Officer
(416) 365-2365
[email protected]
Lenis Quan
Chief Financial Officer
(416) 365-2353
[email protected]
Alexander Sannikov
Chief Operating Officer
(416) 365-4106
[email protected]
Please make the indicated changes including the new text: US quotes snapshot data provided by IEX. Additional price data and company information powered by Twelve Data.