
INK Canadian Insider Index hits oil slick, skids 2.3%
Thank you for joining us in a weekly technical look at the mid-cap oriented INK Canadian Insider (CIN) Index. Last week, the idea of the 1100 level providing support after holding firm on the last 4 re-tests quickly went out the window. As oil plunged 6.8%, the Index slipped on an oil slick of its own and its skid accelerated as the week progressed. In all, the INK CIN wiped out to the tune of 25.8 points or 2.3%.
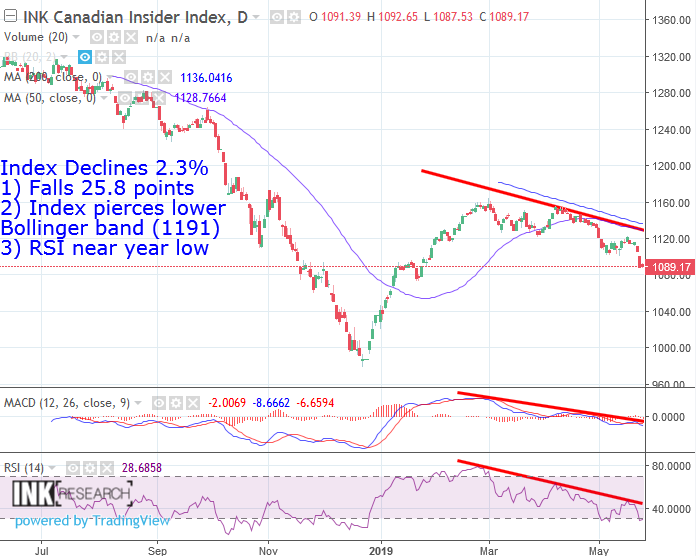
MACD fell 2.62 to -2 while RSI took the elevator down 14.2 points or 33% to 28.69, only two points above its lowest reading of 2019.
Support moves down to the 1089-1093 area (lower Bollinger is at 1191) and 1076. Resistance moves down to 1103 (previous support) and 1120.
The Index which now holds several oil and copper stocks, saw both commodities take a hit last week and followed both key sectors down. Worth noting for the bulls is that the chart of the US dollar is now showing signs of negative divergence in its momentum indicators, a condition that tends to herald a pullback. Indeed, a US dollar correction would have a positive impact for both commodities and stocks in general.
The INK Canadian Insider Index is used by the Horizons Cdn Insider Index ETF (HII), a 2017 and 2018 Fundata Fundgrade A+ ® award winner.
Nike shoes | Nike Air Max 270 - Deine Größe bis zu 70% günstiger
Category:
Please make the indicated changes including the new text: US quotes snapshot data provided by IEX. Additional price data and company information powered by Twelve Data.