
Are Bombardier shares ready to take flight?
Thank you for joining us in a technical look at Bombardier (BBD.B). The company has a very intriguing chart. As you can see, Bombardier shares have been locked in a long sideways consolidation since they bottomed in late-August around $1.10.
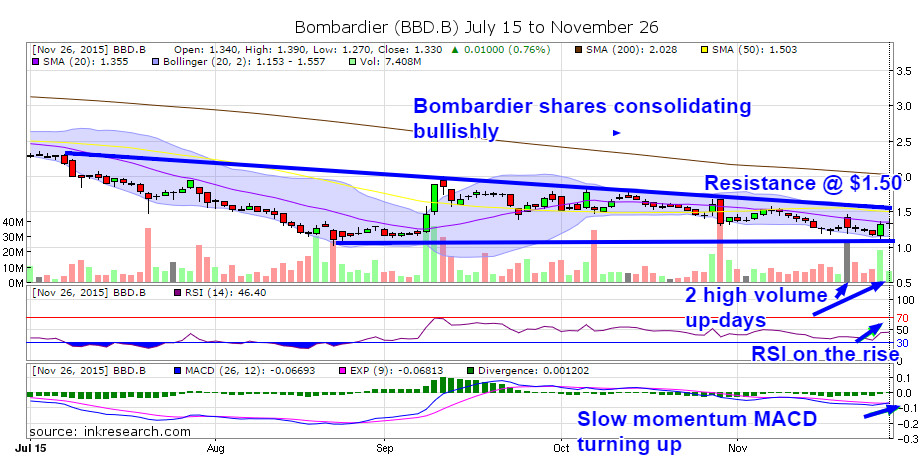
We note with great interest that Bombardier shares have not endured near the volatility many stocks have experienced either during the August sell-off, or in the months that have followed. We take this as a bullish sign that a long and strong base is being built, from which a break-out is the likely outcome. What's more, we've recently observed two very high volume days (20 and 27 million) when shares have risen, suggesting shares are under accumulation.
Another bullish observation is that Bombardier's $1.10 lows of August have not been breached in over three months. The $1.20 support level has been a strong support in late August and again this month. Its lower Bollinger band currently sits around $1.20 providing a natural level of support on its own.
As we look where shares might rise, the stock has been capped over the past month or so by its 20-day simple moving average which is currently around $1.35. Above that, we can see $1.50 is where its resistance line (top blue line) drawn from its July highs connects with its highs in both September and November. Its top Bollinger band also falls on this $1.50 area, providing formidable near-term resistance.
We are seeing some other bullish signs of late. In addition to its bullish volume spikes, we've seen improvement in the stock's momentum. Its RSI indicator which typically reflects near-term changes in momentum, has suddenly accelerated to the upside, rising from 30 to just under 50. In addition, its MACD momentum indicator which is slower to record momentum change, has just turned up, with its fast line eclipsing its slow line, suggesting momentum is back with the bulls.
To sum up, there are many reasons to like Bombardier's chart, and if its recent trend of high volume up-days continue, we can expect Bombardier to take a run at breaking out beyond $1.50. Again, we note that long bases are often a very good predictor of significant-sized rallies and stock breakouts.
This article was published for INK Research subscribers before the market open on November 27th.
Best Authentic Sneakers | 【国内5月2日発売予定】ナイキ ウィメンズ エアマックス ココ サンダル 全4色 - スニーカーウォーズ
Category:
- Please sign in or create an account to leave comments
Please make the indicated changes including the new text: US quotes snapshot data provided by IEX. Additional price data and company information powered by Twelve Data.