
1000 remains key level for INK CIN Index to overcome
Technical Overview by Nicholas Winton, Hedgehog Trader and @HedgehogTrader on Twitter
Thank you for joining us in a technical look at the mid-cap oriented INK Canadian Insider (CIN) Index. In our last update of 2015, with the Index trading under support 1000 and its momentum indicators pointing downward, we suggested the Index might need to correct down to its lower Bollinger band in order to put in a bottom, just as it did in late August. It's interesting that the Index did just that, dropping just below its lower Bollinger band at 960 before rising nearly 4%.
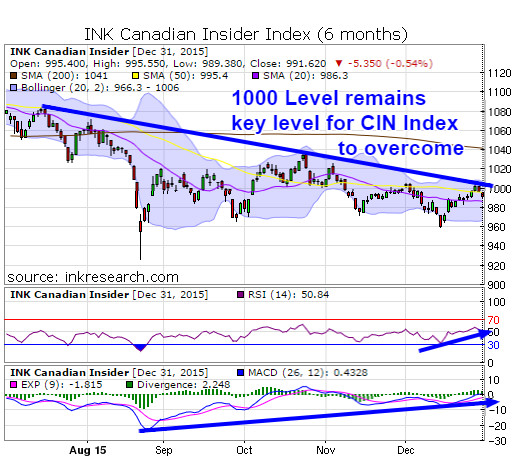
At present, the Index finds itself pushed back by a familiar wall at the 1000 level - which falls along a downward sloping resistance line that links both its August and November highs.
Its momentum indicators MACD and RSI have recently turned up - though we note RSI which is at 50.84, hasn't traded appreciably above this level for more than short bursts over the past couple of months. We'll probably need to see trading volume increase in order for momentum to have a shot at breaking free from its 30-50 trading range. And with the holidays behind us and traders returning to their desks, volume is something that's likely to return.
Support lines are at 966 and 980 and overhead resistance is at 1000-1066.
Category:
- Please sign in or create an account to leave comments
Please make the indicated changes including the new text: US quotes snapshot data provided by IEX. Additional price data and company information powered by Twelve Data.