
Aptar Reports Third Quarter Results; Acquires Noble International, a Leader in Drug Delivery Training Devices and Patient Onboarding; Announces Segment Leadership Appointments
AptarGroup, Inc. (NYSE:ATR), a global leader in consumer dispensing, active packaging and drug delivery solutions, today reported its third quarter 2019 financial results. In addition, Aptar has acquired Noble International (Noble), a leader in drug delivery training devices and patient onboarding and announced certain segment leadership appointments.
This press release features multimedia. View the full release here: https://www.businesswire.com/news/home/20191031005925/en/
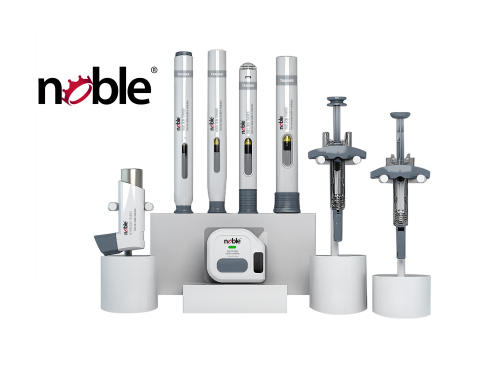
Photo: Noble's Drug Delivery Training Devices
Third Quarter 2019 Summary
- Reported sales increased 5%
- Core sales, excluding currency and acquisition effects, grew 4%
- Reported earnings per share increased 42% to $0.85 compared to prior year earnings per share of $0.60 in part due to lower restructuring and acquisition costs
- Adjusted earnings per share decreased 4% to $0.93 compared to prior year adjusted earnings per share of $0.97 (including comparable exchange rates), primarily due to a difference in the effective tax rate on adjusted earnings (31% vs 24%, or approximately $0.09 per share)
- Reported net income increased 46%
- Adjusted EBITDA increased 9%, despite foreign currency headwinds
- Subsequent to the end of the quarter, acquired Noble, a leader in drug delivery training devices and patient onboarding
Third Quarter Results
For the quarter ended September 30, 2019, reported sales increased to $701 million compared to $666 million in the prior year. Core sales, excluding the impacts from changes in currency exchange rates and acquisitions, increased approximately 4%. Strong broad-based demand for Aptar’s industry leading drug delivery and food dispensing solutions drove top line core growth in the quarter. Further, increased sales to the beauty and home care markets were offset by weak demand from the personal care market in our Beauty + Home segment.
| Third Quarter Segment Sales Analysis (Change Over Prior Year) |
||||
Beauty + Home |
Pharma |
Food + Beverage |
Total AptarGroup |
|
| Core Sales Growth | (1%) |
13% |
2% |
4% |
| Acquisitions | 0% |
9% |
8% |
4% |
| Currency Effects (1) | (3%) |
(4%) |
(2%) |
(3%) |
| Total Reported Sales Growth | (4%) |
18% |
8% |
5% |
| (1) - Currency effects are approximated by translating last year's amounts at this year's foreign exchange rates. | ||||
Our Pharma segment had another outstanding quarter with broad-based demand for our industry leading drug delivery devices. Our Beauty + Home segment faced a weak personal care market, while core sales to the beauty and home care markets increased. Our Food + Beverage segment grew sales as increased demand in the food market overcame weaker product demand from the beverage market, and the negative top line effects of passing on lower raw material costs to our customers. Commenting on the quarter, Stephan Tanda, President and CEO, said, “Given the current backdrop of macro-economic challenges, I am pleased that we grew adjusted EBITDA by 9% with top line growth of 5%. Our ability to bring value to customer brands, across a variety of end markets with the industry’s broadest portfolio of solutions, is a core strength of Aptar. As recently announced, our agreement to acquire an equity interest in the Chinese BTY companies, leading manufacturers of complete color cosmetics packaging solutions, positions us well for more meaningful participation in higher growth markets. We also took another step in expanding our Pharma Services offerings with the acquisition of Noble International, which closed after the quarter ended. While we face some near-term challenges in parts of our business, we are managing for the long-term, and are confident in our strategic growth drivers including these recently announced transactions which bring additional capabilities.”
Aptar reported earnings per share of $0.85 compared to $0.60 reported a year ago. Current year adjusted earnings per share, excluding restructuring costs and acquisition-related expenses, were $0.93 and down 4% from the prior year adjusted earnings per share, including comparable exchange rates, of $0.97. The third quarter effective tax rate on adjusted earnings was 31% compared to 24% in the prior year, resulting in a difference in adjusted earnings per share of approximately $0.09.
Year-to-Date Results
For the nine months ended September 30, 2019, reported sales increased approximately 5% to $2.19 billion from $2.08 billion a year ago. Core sales, which exclude the impacts from changes in currency exchange rates and acquisitions, also increased approximately 5%.
Nine Months Year-to-Date Segment Sales Analysis
|
||||
Beauty + Home |
Pharma |
Food + Beverage |
Total AptarGroup |
|
| Core Sales Growth | 0% |
12% |
5% |
5% |
| Acquisitions | 0% |
12% |
10% |
5% |
| Currency Effects (1) | (5%) |
(6%) |
(3%) |
(5%) |
| Total Reported Sales Growth | (5%) |
18% |
12% |
5% |
| (1) - Currency effects are approximated by translating last year's amounts at this year's foreign exchange rates. | ||||
Tanda commented on the year-to-date results, “We achieved solid top line and earnings growth for the first nine months of the year. Our Pharma segment has performed exceptionally well and our Food + Beverage segment recorded good year-on-year core sales growth, with improved margins. In our Beauty + Home segment, growth in the beauty and home care markets was offset by weak demand from the personal care market, and resulted in core sales that were even with the prior year with slightly improved margins.”
For the nine months year-to-date, Aptar’s reported earnings per share were $2.93, and up 23%, compared to $2.38 reported a year ago. Current year adjusted earnings per share, which exclude restructuring costs and acquisition-related expenses, were $3.15 and up 7% from prior year adjusted earnings per share, adjusted for comparable exchange rates, of $2.94. The year-to-date effective tax rate on adjusted earnings was 29% compared to 26% in the prior year, resulting in a difference in adjusted earnings per share of approximately $0.14.
Noble Acquisition
The acquisition of Noble, which closed on October 31, 2019, is a further step in our strategy to broaden our portfolio of services that support pharmaceutical and biotech customers through all stages of their drug development journey. Noble, a leader in drug delivery training devices and patient onboarding, was acquired for an enterprise value of approximately $62 million that was funded by available cash on hand, with an additional potential earn-out payment after five years up to a maximum of approximately $31 million.
The proper administration of certain medications can be challenging, especially when patients are required to administer the medication themselves. With the movement of treatments from the healthcare provider to the home, the need to ensure accurate, consistent and safe use of the drug delivery device becomes a critical component of the effectiveness of the treatment.
Noble’s purpose is to improve patient experiences and outcomes by developing patient-centric advanced drug delivery system training devices – including autoinjectors, prefilled syringes, on-body and respiratory devices – for the world’s leading biopharmaceutical companies and original equipment manufacturers. Noble has also developed a connected solution for injectable devices, which senses and monitors how a patient interacts with the specific steps of drug delivery and can wirelessly transmit real-time data.
Human behaviors and user experiences are critical elements of Noble’s proprietary training device design process. Combined with patient onboarding programs, Noble’s training devices - which mimic the feel, force and function of the actual drug delivery device - are designed to reduce error and increase device familiarity, both of which are keys to helping patients improve adherence and, ultimately, health outcomes.
Tanda stated, “We are pleased to welcome the Noble team to the Aptar family. This strategic acquisition meets our disciplined approach of acquiring companies with strong positions in attractive markets, proprietary technologies and robust growth fundamentals. The combination of Noble and Aptar will bring additional value to our pharmaceutical customers as they seek to put more life-changing treatments into the hands of empowered patients. Together, we will work toward the ultimate goal of improving patient experiences and health outcomes.”
Noble, founded in 1994 and located in Orlando, Florida, employs 45 people at its state-of-the art training device design headquarters. “Joining Aptar is an important step in our mission to support the healthcare community’s effort to improve patient outcomes through innovation, education and patient access,” said Jeff Baker, Noble CEO. “It is exciting to know that by leveraging the breadth of Aptar’s portfolio and global network, we will now reach more pharmaceutical partners, healthcare professionals, caregivers and, ultimately, patients.”
Wells Fargo Securities acted as the exclusive financial advisor to Aptar in connection with the transaction and Sidley Austin LLP acted as legal counsel.
Segment Leadership Appointments
Aptar has announced that Marc Prieur will be appointed President, Aptar Beauty + Home effective December 1, 2019. Prieur, who had been President, Aptar Food + Beverage since September of 2018, will succeed Eldon Schaffer who will be taking on a new leadership role overseeing strategic projects and commercial excellence initiatives.
Prieur has made substantial contributions to Aptar over the past 20 years, having lived and worked in Europe, the United States and China. He has experience in operations and running businesses in each of Aptar’s business segments, including helping establish the company’s beauty and pharma production in the United States, working in sales and operations in the Consumer Health Care division in Europe and leading Aptar’s Pharma business in Asia. Prieur will continue to oversee the company’s Operational Excellence pillar.
Hedi Tlili, President of Aptar Beauty + Home EMEA, will succeed Prieur as President of Aptar Food + Beverage. Tlili had previously been President of Aptar Food + Beverage EMEA. Prior to joining Aptar in March of 2016, he held various leadership roles in peer packaging companies Albéa and Sonoco, and lived and worked in Europe, the United States and Africa.
Commenting on the leadership appointments, Tanda stated, “We are fortunate to have the ability to draw upon our deep bench and make appointments to key leadership positions. Marc’s extensive engineering and operational acumen, combined with his passion for innovative, sustainable solutions, make him an ideal leader to take our Beauty + Home segment to new heights. His firsthand experience having led our Pharma business in Asia, will also be a tremendous advantage as he and Xiangwei Gong, President of Aptar Asia, work together to further penetrate and grow our Beauty business in the fast-growing Asian region. Hedi has broad experience, having led our EMEA sales and operations for both our Food + Beverage and Beauty + Home segments. He has implemented transformation initiatives in both segments and his knowledge of developing markets, including the Middle East and Africa, will be very important for our strategy execution.”
Outlook
Commenting on Aptar’s outlook, Tanda said, “As discussed during our Capital Markets Day event, we are very encouraged by our growth opportunities and we are taking steps to bring long-term value creation for all stakeholders. However, we are facing a challenging fourth quarter compared to a very strong performance a year ago, which also included a pre-tax gain of $4 million, primarily related to the sale of an equity ownership interest. Customers served by our Beauty + Home segment are destocking as they react to political and economic uncertainties. Our Pharma business, which has been benefitting from above normal expansion in the allergy sector, is expected to revert to a more normalized growth rate.”
Aptar expects earnings per share for the fourth quarter, excluding any restructuring costs and acquisition-related expenses, to be in the range of $0.74 to $0.80 and this guidance is based on an effective tax rate range of 30% to 32%. Prior year adjusted earnings per share of $0.92 included an effective tax rate of approximately 29%.
Cash Dividend
As previously announced, the Board declared a quarterly cash dividend of $0.36 per share. The payment date is November 20, 2019, to stockholders of record as of October 30, 2019.
Open Conference Call
There will be a conference call on Friday, November 1, 2019 at 8:00 a.m. Central Time to discuss the Company’s third quarter and year-to-date results for 2019. The call will last approximately one hour. Interested parties are invited to listen to a live webcast by visiting the Investor Relations page at www.aptar.com. Replay of the conference call can also be accessed for a limited time on the Investor Relations page of the website.
Aptar is a leading global supplier of a broad range of innovative dispensing, sealing and active packaging solutions for the beauty, personal care, home care, prescription drug, consumer health care, injectables, food and beverage markets. Aptar uses insights, design, engineering and science to create innovative packaging technologies that build brand value for its customers, and, in turn, make a meaningful difference in the lives, looks, health and homes of people around the world. Aptar is headquartered in Crystal Lake, Illinois and has over 14,000 dedicated employees in 18 different countries. For more information, visit www.aptar.com.
Presentation of Non-GAAP Information
This press release refers to certain non-GAAP financial measures, including current year adjusted earnings per share and adjusted EBITDA, which exclude the impact of business transformation charges (restructuring initiatives), acquisition-related expenses and purchase accounting adjustments that affected inventory values. Core sales and adjusted earnings per share also neutralize the impact of foreign currency translation effects when comparing current results to the prior year. Non-GAAP financial measures may not be comparable to similarly titled non-GAAP financial measures provided by other companies. Aptar’s management believes these non-GAAP financial measures provide useful information to our investors because they allow for a better period over period comparison of operating results by removing the impact of items that, in management’s view, do not reflect Aptar’s core operating performance. These non-GAAP financial measures also provide investors with certain information used by Aptar’s management when making financial and operational decisions. These non-GAAP financial measures should not be considered in isolation or as a substitute for GAAP financial results, but should be read in conjunction with the unaudited condensed consolidated statements of income and other information presented herein. A reconciliation of non-GAAP financial measures to the most directly comparable GAAP measures is included in the accompanying tables. Our outlook is provided on a non-GAAP basis because certain reconciling items are dependent on future events that either cannot be controlled, such as exchange rates, or reliably predicted because they are not part of the Company's routine activities, such as restructuring and acquisition costs.
This press release contains forward-looking statements, including certain statements set forth under the “Outlook” section of this press release and statements regarding the anticipated effect of acquisitions. Words such as “expects,” “anticipates,” “believes,” “estimates,” “future,” “potential” and other similar expressions or future or conditional verbs such as “will,” “should,” “would” and “could” are intended to identify such forward-looking statements. Forward-looking statements are made pursuant to the safe harbor provisions of Section 27A of the Securities Act of 1933 and Section 21E of the Securities Exchange Act of 1934 and are based on our beliefs as well as assumptions made by and information currently available to us. Accordingly, our actual results may differ materially from those expressed or implied in such forward-looking statements due to known or unknown risks and uncertainties that exist in our operations and business environment including, but not limited to: the successful integration of acquisitions; the impact of tax reform legislation including changes in tax rates and other tax-related events or transactions that could impact our effective tax rate; the execution of the business transformation plan; economic conditions worldwide including potential deflationary or inflationary conditions in regions we rely on for growth; political conditions worldwide; significant fluctuations in foreign currency exchange rates; changes in customer and/or consumer spending levels; financial conditions of customers and suppliers; consolidations within our customer or supplier bases; fluctuations in the cost of materials, components and other input costs; the availability of raw materials and components; our ability to successfully implement facility expansions and new facility projects; our ability to increase prices, contain costs and improve productivity; changes in capital availability or cost, including interest rate fluctuations; volatility of global credit markets; cybersecurity threats that could impact our networks and reporting systems; fiscal and monetary policies and other regulations; direct or indirect consequences of acts of war or terrorism; work stoppages due to labor disputes; and competition, including technological advances. For additional information on these and other risks and uncertainties, please see our filings with the Securities and Exchange Commission, including the discussion under “Risk Factors” and “Management’s Discussion and Analysis of Financial Condition and Results of Operations” in our Form 10-Ks and Form 10-Qs. We undertake no obligation to update publicly any forward-looking statements, whether as a result of new information, future events or otherwise, except as required by law.
AptarGroup, Inc. |
||||||||||||
Condensed Consolidated Financial Statements (Unaudited) |
||||||||||||
(In Thousands, Except Per Share Data) |
||||||||||||
Consolidated Statements of Income |
||||||||||||
Three Months Ended |
Nine Months Ended |
|||||||||||
September 30, |
September 30, |
|||||||||||
2019 |
2018 |
2019 |
2018 |
|||||||||
| Net Sales | $ |
701,278 |
|
$ |
665,775 |
|
$ |
2,188,399 |
|
$ |
2,079,733 |
|
| Cost of Sales (exclusive of depreciation and amortization shown below) (1) |
|
444,237 |
|
|
435,379 |
|
|
1,382,810 |
|
|
1,355,445 |
|
| Selling, Research & Development and Administrative (2) |
|
111,559 |
|
|
103,574 |
|
|
346,526 |
|
|
323,146 |
|
| Depreciation and Amortization |
|
49,218 |
|
|
41,857 |
|
|
144,574 |
|
|
123,133 |
|
| Restructuring Initiatives |
|
6,019 |
|
|
23,852 |
|
|
17,286 |
|
|
48,002 |
|
| Operating Income |
|
90,245 |
|
|
61,113 |
|
|
297,203 |
|
|
230,007 |
|
| Other Income/(Expense): | ||||||||||||
| Interest Expense |
|
(8,898 |
) |
|
(8,735 |
) |
|
(26,868 |
) |
|
(24,754 |
) |
| Interest Income |
|
957 |
|
|
1,537 |
|
|
3,738 |
|
|
6,306 |
|
| Equity in Results of Affiliates |
|
238 |
|
|
(45 |
) |
|
152 |
|
|
(130 |
) |
| Miscellaneous, net |
|
(269 |
) |
|
(2,928 |
) |
|
148 |
|
|
(4,372 |
) |
| Income before Income Taxes |
|
82,273 |
|
|
50,942 |
|
|
274,373 |
|
|
207,057 |
|
| Provision for Income Taxes |
|
25,504 |
|
|
11,920 |
|
|
80,684 |
|
|
52,966 |
|
| Net Income | $ |
56,769 |
|
$ |
39,022 |
|
$ |
193,689 |
|
$ |
154,091 |
|
| Net (Income) Loss Attributable to Noncontrolling Interests |
|
(19 |
) |
|
(26 |
) |
|
(20 |
) |
|
(20 |
) |
| Net Income Attributable to AptarGroup, Inc. | $ |
56,750 |
|
$ |
38,996 |
|
$ |
193,669 |
|
$ |
154,071 |
|
| Net Income Attributable to AptarGroup, Inc. per Common Share: | ||||||||||||
| Basic | $ |
0.89 |
|
$ |
0.63 |
|
$ |
3.05 |
|
$ |
2.47 |
|
| Diluted | $ |
0.85 |
|
$ |
0.60 |
|
$ |
2.93 |
|
$ |
2.38 |
|
| Average Numbers of Shares Outstanding: | ||||||||||||
| Basic |
|
64,010 |
|
|
62,378 |
|
|
63,485 |
|
|
62,304 |
|
| Diluted |
|
66,702 |
|
|
65,129 |
|
|
66,163 |
|
|
64,822 |
|
| Notes to the Condensed Consolidated Financial Statements: | ||||||||||||
| (1) For the three and nine months ended September 30, 2019, Cost of Sales included the effect of approximately $0.6 million and $0.9 million, respectively, of purchase accounting adjustments to inventory and backlog related to acquisitions. For the three and nine months ended September 30, 2018, Cost of Sales included the effect of approximately $3.3 million and $3.4 million, respectively, of purchase accounting adjustments to inventory related to acquisitions. | ||||||||||||
(2) For the three and nine months ended September 30, 2019, Selling, Research & Development and Administrative included approximately $0.7 million and $1.8 million, respectively, of acquisition costs. For the three and nine months ended September 30, 2018, Selling, Research & Development and Administrative included approximately $7.1 million and $9.5 million, respectively, of acquisition costs. |
||||||||||||
AptarGroup, Inc. |
|||||
Condensed Consolidated Financial Statements (Unaudited) |
|||||
(continued) |
|||||
($ In Thousands) |
|||||
Consolidated Balance Sheets |
|||||
September 30, 2019 |
December 31, 2018 |
||||
| ASSETS | |||||
| Cash and Equivalents | $ |
270,577 |
$ |
261,823 |
|
| Receivables, net |
|
552,289 |
|
569,630 |
|
| Inventories |
|
383,491 |
|
381,110 |
|
| Other Current Assets |
|
118,371 |
|
118,245 |
|
| Total Current Assets |
|
1,324,728 |
|
1,330,808 |
|
| Net Property, Plant and Equipment |
|
1,042,739 |
|
991,613 |
|
| Goodwill |
|
722,070 |
|
712,095 |
|
| Other Assets |
|
375,602 |
|
343,219 |
|
| Total Assets | $ |
3,465,139 |
$ |
3,377,735 |
|
| LIABILITIES AND EQUITY | |||||
| Short-Term Obligations | $ |
111,217 |
$ |
163,971 |
|
| Accounts Payable and Accrued Liabilities |
|
537,620 |
|
525,199 |
|
| Total Current Liabilities |
|
648,837 |
|
689,170 |
|
| Long-Term Obligations |
|
1,075,153 |
|
1,125,993 |
|
| Deferred Liabilities |
|
187,170 |
|
139,701 |
|
| Total Liabilities |
|
1,911,160 |
|
1,954,864 |
|
| AptarGroup, Inc. Stockholders' Equity |
|
1,553,656 |
|
1,422,556 |
|
| Noncontrolling Interests in Subsidiaries |
|
323 |
|
315 |
|
| Total Equity |
|
1,553,979 |
|
1,422,871 |
|
| Total Liabilities and Equity | $ |
3,465,139 |
$ |
3,377,735 |
|
AptarGroup, Inc. |
||||||||||||||||||
Reconciliation of Adjusted EBIT and Adjusted EBITDA to Net Income (Unaudited) |
||||||||||||||||||
($ In Thousands) |
||||||||||||||||||
Three Months Ended |
||||||||||||||||||
September 30, 2019 |
||||||||||||||||||
Consolidated |
Beauty + Home |
Pharma |
Food + Beverage |
Corporate & Other |
Net Interest |
|||||||||||||
| Net Sales | $ |
701,278 |
|
|
328,182 |
|
|
269,251 |
|
|
103,845 |
|
|
- |
|
|
- |
|
| Reported net income | $ |
56,769 |
|
|||||||||||||||
| Reported income taxes |
|
25,504 |
|
|||||||||||||||
| Reported income before income taxes |
|
82,273 |
|
|
15,413 |
|
|
78,418 |
|
|
9,323 |
|
|
(12,940 |
) |
|
(7,941 |
) |
| Adjustments: | ||||||||||||||||||
| Restructuring initiatives |
|
6,019 |
|
|
5,341 |
|
|
168 |
|
|
204 |
|
|
306 |
|
|||
| Transaction costs related to acquisitions |
|
708 |
|
|
34 |
|
|
520 |
|
|
154 |
|
||||||
| Purchase accounting adjustments related to acquired companies' inventory and backlog |
|
647 |
|
|
647 |
|
||||||||||||
| Adjusted earnings before income taxes |
|
89,647 |
|
|
20,788 |
|
|
79,753 |
|
|
9,681 |
|
|
(12,634 |
) |
|
(7,941 |
) |
| Interest expense |
|
8,898 |
|
|
8,898 |
|
||||||||||||
| Interest income |
|
(957 |
) |
|
(957 |
) |
||||||||||||
| Adjusted earnings before net interest and taxes (Adjusted EBIT) |
|
97,588 |
|
|
20,788 |
|
|
79,753 |
|
|
9,681 |
|
|
(12,634 |
) |
|
- |
|
| Depreciation and amortization |
|
49,218 |
|
|
20,687 |
|
|
16,793 |
|
|
9,047 |
|
|
2,691 |
|
|
- |
|
| Adjusted earnings before net interest, taxes, depreciation and amortization (Adjusted EBITDA) | $ |
146,806 |
|
$ |
41,475 |
|
$ |
96,546 |
|
$ |
18,728 |
|
$ |
(9,943 |
) |
$ |
- |
|
| Adjusted EBITDA margins (Adjusted EBITDA / Reported Net Sales) |
|
20.9 |
% |
|
12.6 |
% |
|
35.9 |
% |
|
18.0 |
% |
||||||
Three Months Ended |
||||||||||||||||||
September 30, 2018 |
||||||||||||||||||
Consolidated |
Beauty + Home |
Pharma |
Food + Beverage |
Corporate & Other |
Net Interest |
|||||||||||||
| Net Sales | $ |
665,775 |
|
|
341,760 |
|
|
227,515 |
|
|
96,500 |
|
|
- |
|
|
- |
|
| Reported net income | $ |
39,022 |
|
|||||||||||||||
| Reported income taxes |
|
11,920 |
|
|||||||||||||||
| Reported income before income taxes |
|
50,942 |
|
|
3,471 |
|
|
67,016 |
|
|
5,481 |
|
|
(17,828 |
) |
|
(7,198 |
) |
| Adjustments: | ||||||||||||||||||
| Restructuring initiatives |
|
23,852 |
|
|
18,854 |
|
|
2,008 |
|
|
2,638 |
|
|
352 |
|
|||
| Transaction costs related to acquisitions |
|
7,082 |
|
|
7,082 |
|
||||||||||||
| Purchase accounting adjustments related to acquired companies' inventory |
|
3,287 |
|
|
2,761 |
|
|
526 |
|
|||||||||
| Adjusted earnings before income taxes |
|
85,163 |
|
|
22,325 |
|
|
71,785 |
|
|
8,645 |
|
|
(10,394 |
) |
|
(7,198 |
) |
| Interest expense |
|
8,735 |
|
|
8,735 |
|
||||||||||||
| Interest income |
|
(1,537 |
) |
|
(1,537 |
) |
||||||||||||
| Adjusted earnings before net interest and taxes (Adjusted EBIT) |
|
92,361 |
|
|
22,325 |
|
|
71,785 |
|
|
8,645 |
|
|
(10,394 |
) |
|
- |
|
| Depreciation and amortization |
|
41,857 |
|
|
19,849 |
|
|
12,731 |
|
|
6,837 |
|
|
2,440 |
|
|
- |
|
| Adjusted earnings before net interest, taxes, depreciation and amortization (Adjusted EBITDA) | $ |
134,218 |
|
$ |
42,174 |
|
$ |
84,516 |
|
$ |
15,482 |
|
$ |
(7,954 |
) |
$ |
- |
|
| Adjusted EBITDA margins (Adjusted EBITDA / Reported Net Sales) |
|
20.2 |
% |
|
12.3 |
% |
|
37.1 |
% |
|
16.0 |
% |
||||||
AptarGroup, Inc. |
||||||||||||||||||
Reconciliation of Adjusted EBIT and Adjusted EBITDA to Net Income (Unaudited) |
||||||||||||||||||
($ In Thousands) |
||||||||||||||||||
Nine Months Ended |
||||||||||||||||||
September 30, 2019 |
||||||||||||||||||
Consolidated |
Beauty + Home |
Pharma |
Food + Beverage |
Corporate & Other |
Net Interest |
|||||||||||||
| Net Sales | $ |
2,188,399 |
|
|
1,037,921 |
|
|
823,891 |
|
|
326,587 |
|
|
- |
|
|
- |
|
| Reported net income | $ |
193,689 |
|
|||||||||||||||
| Reported income taxes |
|
80,684 |
|
|||||||||||||||
| Reported income before income taxes |
|
274,373 |
|
|
66,407 |
|
|
244,101 |
|
|
29,234 |
|
|
(42,239 |
) |
|
(23,130 |
) |
| Adjustments: | ||||||||||||||||||
| Restructuring initiatives |
|
17,286 |
|
|
14,869 |
|
|
381 |
|
|
826 |
|
|
1,210 |
|
|||
| Transaction costs related to acquisitions |
|
1,767 |
|
|
34 |
|
|
1,579 |
|
|
154 |
|
||||||
| Purchase accounting adjustments related to acquired companies' inventory and backlog |
|
869 |
|
|
869 |
|
||||||||||||
| Adjusted earnings before income taxes |
|
294,295 |
|
|
81,310 |
|
|
246,930 |
|
|
30,214 |
|
|
(41,029 |
) |
|
(23,130 |
) |
| Interest expense |
|
26,868 |
|
|
26,868 |
|
||||||||||||
| Interest income |
|
(3,738 |
) |
|
(3,738 |
) |
||||||||||||
| Adjusted earnings before net interest and taxes (Adjusted EBIT) |
|
317,425 |
|
|
81,310 |
|
|
246,930 |
|
|
30,214 |
|
|
(41,029 |
) |
|
- |
|
| Depreciation and amortization |
|
144,574 |
|
|
62,101 |
|
|
48,623 |
|
|
26,149 |
|
|
7,701 |
|
|
- |
|
| Adjusted earnings before net interest, taxes, depreciation and amortization (Adjusted EBITDA) | $ |
461,999 |
|
$ |
143,411 |
|
$ |
295,553 |
|
$ |
56,363 |
|
$ |
(33,328 |
) |
$ |
- |
|
| Adjusted EBITDA margins (Adjusted EBITDA / Reported Net Sales) |
|
21.1 |
% |
|
13.8 |
% |
|
35.9 |
% |
|
17.3 |
% |
||||||
Nine Months Ended |
||||||||||||||||||
September 30, 2018 |
||||||||||||||||||
Consolidated |
Beauty + Home |
Pharma |
Food + Beverage |
Corporate & Other |
Net Interest |
|||||||||||||
| Net Sales | $ |
2,079,733 |
|
|
1,088,469 |
|
|
698,851 |
|
|
292,413 |
|
|
- |
|
|
- |
|
| Reported net income | $ |
154,091 |
|
|||||||||||||||
| Reported income taxes |
|
52,966 |
|
|||||||||||||||
| Reported income before income taxes |
|
207,057 |
|
|
40,688 |
|
|
208,915 |
|
|
21,736 |
|
|
(45,834 |
) |
|
(18,448 |
) |
| Adjustments: | ||||||||||||||||||
| Restructuring initiatives |
|
48,002 |
|
|
38,501 |
|
|
3,596 |
|
|
4,307 |
|
|
1,598 |
|
|||
| Transaction costs related to acquisitions |
|
9,526 |
|
|
574 |
|
|
8,952 |
|
|||||||||
| Purchase accounting adjustments related to acquired companies' inventory |
|
3,406 |
|
|
119 |
|
|
2,761 |
|
|
526 |
|
||||||
| Adjusted earnings before income taxes |
|
267,991 |
|
|
79,882 |
|
|
215,272 |
|
|
26,569 |
|
|
(35,284 |
) |
|
(18,448 |
) |
| Interest expense |
|
24,754 |
|
|
24,754 |
|
||||||||||||
| Interest income |
|
(6,306 |
) |
|
(6,306 |
) |
||||||||||||
| Adjusted earnings before net interest and taxes (Adjusted EBIT) |
|
286,439 |
|
|
79,882 |
|
|
215,272 |
|
|
26,569 |
|
|
(35,284 |
) |
|
- |
|
| Depreciation and amortization |
|
123,133 |
|
|
61,273 |
|
|
35,437 |
|
|
19,715 |
|
|
6,708 |
|
|
- |
|
| Adjusted earnings before net interest, taxes, depreciation and amortization (Adjusted EBITDA) | $ |
409,572 |
|
$ |
141,155 |
|
$ |
250,709 |
|
$ |
46,284 |
|
$ |
(28,576 |
) |
$ |
- |
|
| Adjusted EBITDA margins (Adjusted EBITDA / Reported Net Sales) |
|
19.7 |
% |
|
13.0 |
% |
|
35.9 |
% |
|
15.8 |
% |
||||||
| AptarGroup, Inc. | ||||||||||||
| Reconciliation of Adjusted Earnings Per Diluted Share (Unaudited) | ||||||||||||
| (In Thousands, Except Per Share Data) | ||||||||||||
Three Months Ended |
Nine Months Ended |
|||||||||||
September 30, |
September 30, |
|||||||||||
2019 |
2018 |
2019 |
2018 |
|||||||||
| Income before Income Taxes | $ |
82,273 |
|
$ |
50,942 |
|
$ |
274,373 |
|
$ |
207,057 |
|
| Adjustments: | ||||||||||||
| Restructuring initiatives |
|
6,019 |
|
|
23,852 |
|
|
17,286 |
|
|
48,002 |
|
| Transaction costs related to acquisitions |
|
708 |
|
|
7,082 |
|
|
1,767 |
|
|
9,526 |
|
| Purchase accounting adjustments related to acquired companies' inventory |
|
647 |
|
|
3,287 |
|
|
869 |
|
|
3,406 |
|
| Foreign currency effects (1) |
|
(2,420 |
) |
|
(12,010 |
) |
||||||
| Adjusted Income before Income Taxes | $ |
89,647 |
|
$ |
82,743 |
|
$ |
294,295 |
|
$ |
255,981 |
|
| Provision for Income Taxes | $ |
25,504 |
|
$ |
11,920 |
|
$ |
80,684 |
|
$ |
52,966 |
|
| Adjustments: | ||||||||||||
| Restructuring initiatives |
|
1,691 |
|
|
6,802 |
|
|
4,857 |
|
|
13,730 |
|
| Transaction costs related to acquisitions |
|
101 |
|
|
847 |
|
|
154 |
|
|
1,475 |
|
| Purchase accounting adjustments related to acquired companies' inventory |
|
123 |
|
|
843 |
|
|
165 |
|
|
884 |
|
| Foreign currency effects (1) |
|
(815 |
) |
|
(3,410 |
) |
||||||
| Adjusted Provision for Income Taxes | $ |
27,419 |
|
$ |
19,597 |
|
$ |
85,860 |
|
$ |
65,645 |
|
| Net Income Attributable to Noncontrolling Interests | $ |
(19 |
) |
$ |
(26 |
) |
$ |
(20 |
) |
$ |
(20 |
) |
| Net Income Attributable to AptarGroup, Inc. | $ |
56,750 |
|
$ |
38,996 |
|
$ |
193,669 |
|
$ |
154,071 |
|
| Adjustments: | ||||||||||||
| Restructuring initiatives |
|
4,328 |
|
|
17,050 |
|
|
12,429 |
|
|
34,272 |
|
| Transaction costs related to acquisitions |
|
607 |
|
|
6,235 |
|
|
1,613 |
|
|
8,051 |
|
| Purchase accounting adjustments related to acquired companies' inventory |
|
524 |
|
|
2,444 |
|
|
704 |
|
|
2,522 |
|
| Foreign currency effects (1) |
|
(1,605 |
) |
|
(8,600 |
) |
||||||
| Adjusted Net Income Attributable to AptarGroup, Inc. | $ |
62,209 |
|
$ |
63,120 |
|
$ |
208,415 |
|
$ |
190,316 |
|
| Average Number of Diluted Shares Outstanding |
|
66,702 |
|
|
65,129 |
|
|
66,163 |
|
|
64,822 |
|
| Net Income Attributable to AptarGroup, Inc. Per Diluted Share | $ |
0.85 |
|
$ |
0.60 |
|
$ |
2.93 |
|
$ |
2.38 |
|
| Adjustments: | ||||||||||||
| Restructuring initiatives |
|
0.06 |
|
|
0.26 |
|
|
0.19 |
|
|
0.53 |
|
| Transaction costs related to acquisitions |
|
0.01 |
|
|
0.09 |
|
|
0.02 |
|
|
0.12 |
|
| Purchase accounting adjustments related to acquired companies' inventory |
|
0.01 |
|
|
0.04 |
|
|
0.01 |
|
|
0.04 |
|
| Foreign currency effects (1) |
|
(0.02 |
) |
|
(0.13 |
) |
||||||
| Adjusted Net Income Attributable to AptarGroup, Inc. Per Diluted Share | $ |
0.93 |
|
$ |
0.97 |
|
$ |
3.15 |
|
$ |
2.94 |
|
| (1) Foreign currency effects are approximations of the adjustment necessary to state the prior year earnings and earnings per share using current period foreign currency exchange rates. | ||||||||||||
AptarGroup, Inc. |
||||
Reconciliation of Adjusted Earnings Per Diluted Share (Unaudited) |
||||
(In Thousands, Except Per Share Data) |
||||
Three Months Ending |
||||
December 31, |
||||
Expected 2019 |
2018 |
|||
| Income before Income Taxes | $ |
58,963 |
|
|
| Adjustments: | ||||
| Restructuring initiatives |
|
15,827 |
|
|
| Transaction costs related to acquisitions |
|
72 |
|
|
| Purchase accounting adjustments related to acquired companies' inventory |
|
10,766 |
|
|
| Foreign currency effects (1) |
|
(402 |
) |
|
| Adjusted Income before Income Taxes | $ |
85,226 |
|
|
| Provision for Income Taxes | $ |
18,288 |
|
|
| Adjustments: | ||||
| Restructuring initiatives |
|
4,447 |
|
|
| Transaction costs related to acquisitions |
|
- |
|
|
| Purchase accounting adjustments related to acquired companies' inventory |
|
2,466 |
|
|
| Foreign currency effects (1) |
|
(211 |
) |
|
| Adjusted Provision for Income Taxes | $ |
24,990 |
|
|
| Net Income Attributable to Noncontrolling Interests | $ |
(1 |
) |
|
| Net Income Attributable to AptarGroup, Inc. | $ |
40,674 |
|
|
| Adjustments: | ||||
| Restructuring initiatives |
|
11,380 |
|
|
| Transaction costs related to acquisitions |
|
72 |
|
|
| Purchase accounting adjustments related to acquired companies' inventory |
|
8,300 |
|
|
| Foreign currency effects (1) |
|
(191 |
) |
|
| Adjusted Net Income Attributable to AptarGroup, Inc. | $ |
60,235 |
|
|
| Average Number of Diluted Shares Outstanding |
|
65,344 |
|
|
| Net Income Attributable to AptarGroup, Inc. Per Diluted Share (2) | $ |
0.62 |
|
|
| Adjustments: | ||||
| Restructuring initiatives |
|
0.17 |
|
|
| Transaction costs related to acquisitions |
|
- |
|
|
| Purchase accounting adjustments related to acquired companies' inventory |
|
0.13 |
|
|
| Foreign currency effects (1) |
|
- |
|
|
| Adjusted Net Income Attributable to AptarGroup, Inc. Per Diluted Share (2) | $0.74 - $0.80 |
$ |
0.92 |
|
| (1) Foreign currency effects are approximations of the adjustment necessary to state the prior year earnings per share using foreign currency exchange rates as of September 30, 2019, with the exception of the euro for which a 1.11 rate was used. | ||||
| (2) AptarGroup’s expected earnings per share range, excluding any restructuring costs, for the fourth quarter of 2019 is based on an effective tax rate range of 30% to 32%. This tax rate range compares to our fourth quarter of 2018 effective tax rate of 31% on reported earnings per share and 29% on adjusted earnings per share. | ||||
View source version on businesswire.com: https://www.businesswire.com/news/home/20191031005925/en/
Investor Relations Contact:
Matt DellaMaria
[email protected]
815-477-0424
Media Contact:
Katie Reardon
[email protected]
815-477-0424
Please make the indicated changes including the new text: US quotes snapshot data provided by IEX. Additional price data and company information powered by Twelve Data.