
Is the INK CIN Index poised to break out of its consolidation?
Thank you for joining us in a weekly technical look at the mid-cap oriented INK Canadian Insider (CIN) Index. Last week, the INK CIN was turned back on an attempted move above 1280 and tumbled back to the 1252-53 area, a support provided by its lower Bollinger band. The Index held there twice before rising upwards once again. It closed at 1269.09 for a 6.4 point loss.
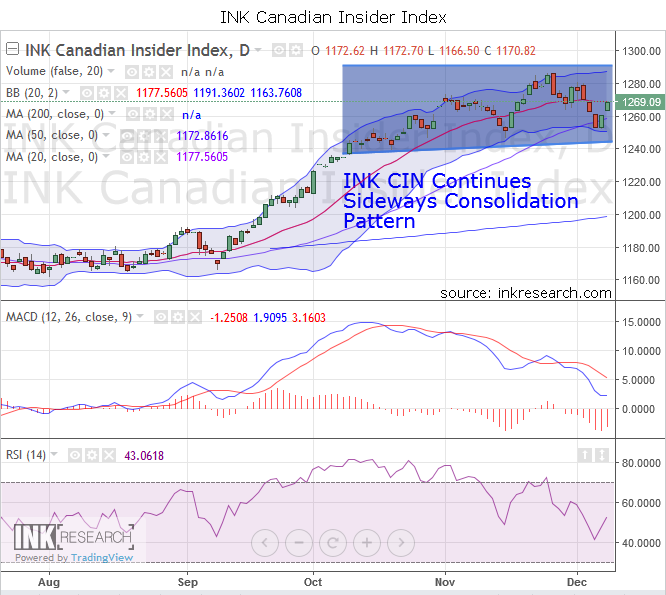
Support is now at 1253 and 1260, while resistance is at 1280 and 1287.
MACD fell hard 2 points to -3. RSI fell 6.5 points but held above the key 50-point level, at 52.8. What is interesting is that the Index bounced hard after making a steep plunge into the 40 area, the same low region the Index bounced from in September before it went on a powerful 100-point rally. Will this second rebound off the 40 point level prove an important technical event? I think it most likely.
Over the last few weeks, the Index has made a series of new all-time highs and has now pulled back on successive weeks with momentum strongly declining. So what do we make of this? Well, when we step back to look at the big picture, we see a pattern of a sideways consolidation. What's more the pattern looks very bullish considering that along the way the Index has also made three higher lows since late October. Now, should we start to see gold and silver stocks begin to rally this week as I am forecasting, The Index is almost certain to follow.
Category:
- Please sign in or create an account to leave comments
Please make the indicated changes including the new text: US quotes snapshot data provided by IEX. Additional price data and company information powered by Twelve Data.