
INK Canadian Insider Index surges 1.7% to new all-time highs!
Thank you for joining us in a weekly technical look at the mid-cap oriented INK Canadian Insider (CIN) Index. Last week, the Index continued to bubble higher still, rising 21 points or 1.7% to close at 1235.14, a mere 0.36 points below its all-time closing high achieved on Thursday.
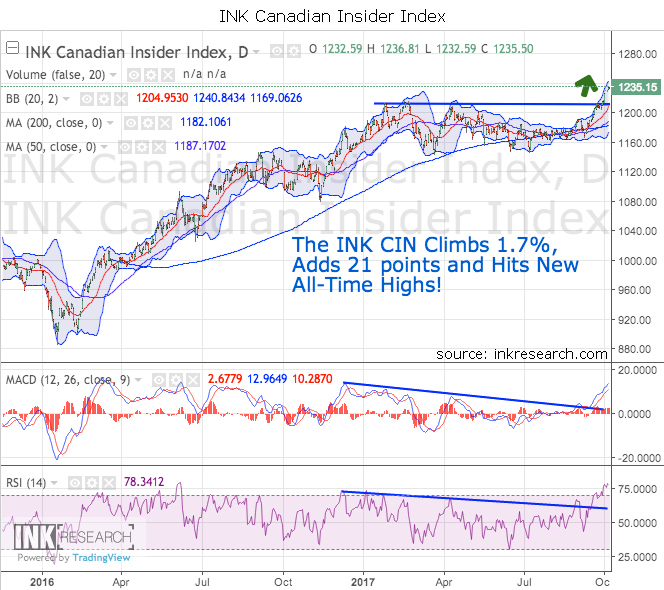
Our short-term momentum indicator, RSI, remains in the hot zone and rose almost 8 points to 77.85. Our long-term momentum indicator, MACD, rose 45% from 1.75 to 2.53. Importantly, the MACD slow and fast lines continue their bullish, higher trending action and have now moved above the key 10 level with the fast line closing at 13.38.
Strong support sits in the 1210-1215 region and 1200 below. Resistance is at 1235 and 1240 above. The Index is performing very bullishly, and the technicals are now reflecting this. Given that RSI is in overbought territory and at its highest level in nearly 18 months, we could see the Index resting and consolidating some of its recent gains before continuing to move higher. However, it's worth noting that in bull markets, commodities, stocks, and ETFs can remain heavily overbought for long periods.
Category:
- Please sign in or create an account to leave comments
Please make the indicated changes including the new text: US quotes snapshot data provided by IEX. Additional price data and company information powered by Twelve Data.