
INK Canadian Insider Index deflates after US election
Thank you for joining us in a weekly technical look at the mid-cap oriented INK Canadian Insider (CIN) Index. Following the Nov 8th US elections which anointed outspoken reality-TV kingpin and real estate mogul Donald Trump as the president-elect, the Index moved inverse to the huge rally in the US markets and followed the sell-off in gold, as it tumbled 31 points or nearly 3% to 1087.65.
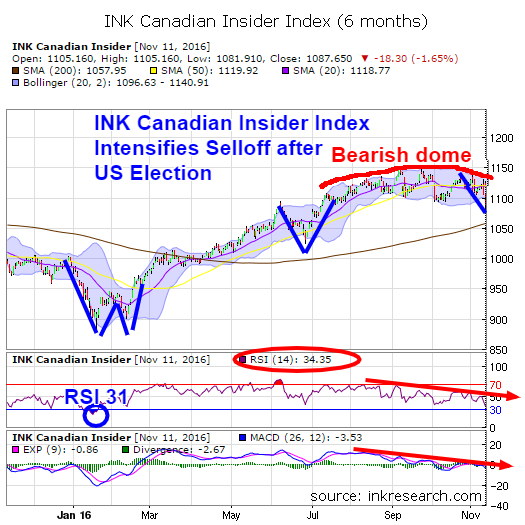
The Index's short-term momentum indicator RSI dropped 9 points or 20% to 34.35, making a significant multi-month low. RSI hasn't been this low since back on Jan 21st when it hit 31.29.
The Index's MACD indicator fell 3 more points, making it a 5-point loss over the past two weeks and now reads -3.53.
The Index's support levels are at 1080 and 1057 (its 200-day moving average), while 1100 and 1110 provide resistance. What's more, as we've illustrated - the Index has now begun to form a rounded dome resistance pattern which will require a great deal of force to defeat or break out of.
The Index has now been in a strong tailspin for a couple of weeks and has shown indications of technical weakness for even longer. Bulls hope this recent steep decline will bring about a capitulation, a final bottom upon which the Index can build a new uptrend. We don't want to look too far ahead but we have seen examples of the Index sharply selling off before giving rise to a new uptrend both in January (a 'W'-shaped rebound) and again in June (a 'V'-shaped rebound). For now, we'll be watching to see how strong of a rebound the Index can generate from these panic-driven, oversold levels.
best Running shoes | New Balance 530 Til Kvinder, hvid - MR530SG
Category:
- Please sign in or create an account to leave comments
Disclaimer :: Use of this site is subject to, and your continued use
constitutes your express agreement to be bound by, our Legal and Terms of Use. Any commercial use of this site is
strictly prohibited. Canadianinsider.com is operated by INK Research Corp (INK). INK provides general information.
INK has made all reasonable efforts to ensure that all information provided is accurate at the time of inclusion;
however, there may be errors. INK makes no guarantee of accuracy or completeness. All information and opinion
expressed herein is subject to change without notice. Read more...Insider information is based on filings made on the System
for Electronic Disclosure for Insiders (SEDI®). Data is provided “as is” and by using this site
you acknowledge that the information which comprises the data is filed by or on behalf of the SEDI filers or other
parties legally required or permitted to do so. Filings may at any time contain errors and by using this site you
acknowledge this fact. INK is not an investment advisory service, a financial planner, an investment advisor nor a
securities advisor. INK does not purport to tell people, or suggest to people, what they should buy or sell for
themselves. Opinions and recommendations contained herein should not be construed as investment advice. Do not
assume that any recommendations, insights, charts, theories, or philosophies will ensure profitable investment.
Users should always consult with and obtain advice from their professional licensed financial advisor, including
their tax advisor, to determine the suitability of any investment. INK recommends that anyone making an investment
or trading securities do so with caution. Users should perform full due diligence and investigate any security
fully before making an investment or before the execution of a security trade based upon information learned
through INK. Investors should obtain annual reports and other company information to complete their own due
diligence in any investment. Neither INK nor anyone affiliated with INK is responsible for any investment decision
made. INK employees may have an ownership or investment interest in any stock mentioned in this service or on this
website. On this site, there may be third party content, content from authors or links to third-party sites or
pages, the contents of which are not verified, maintained, controlled or supervised by INK. INK is not responsible
for and assumes no liability for the accuracy, completeness or timeliness of any third party content or authored
content provided herein or the information or contents of any linked sites or pages. The inclusion of any authored
content or link by us does not imply that INK recommends, approves or endorses the authored content or linked site
or pages. INK Edge® and INK Research® are registered trade-marks owned by INK Research Corp. SEDI®
is a registered trade-mark owned by the Alberta Securities Commission.Read less
Please make the indicated changes including the new text: US quotes snapshot data provided by IEX. Additional price data and company information powered by Twelve Data.
Interactive technical study charts by TradingView. Copyright © 2024 INK Research Corp. All rights reserved. All trade-marks or trade names not owned by INK Research Corp. are the property of their respective owners.