
INK Canadian Insider Index surges, continues sideways consolidation
Thank you for joining us in a weekly technical look at the mid-cap oriented INK Canadian Insider (CIN) Index. The Index finally found its footing last week, paralleling strength in the TSX Composite Index (which quietly notched a new 2016 high) and in mining stocks which rose 3%. The INK Canadian Insider Index put together an impressive week, as it rocketed 24.3 points or 2.2%, regaining all of its losses over the past 3 weeks.
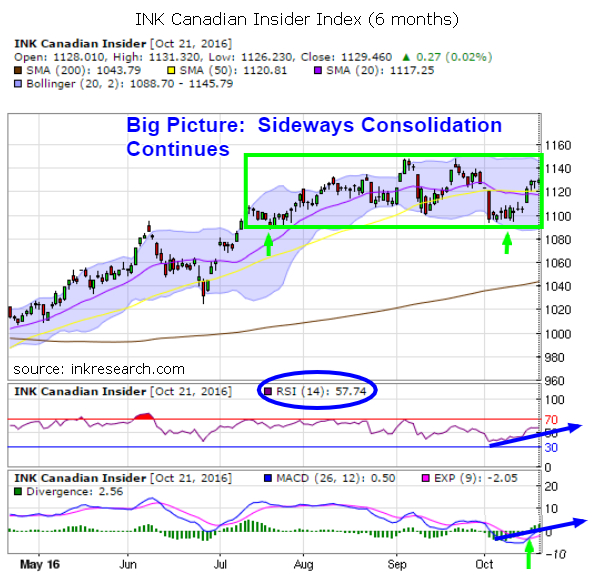
Our short-term momentum indicator RSI surged above the 50 point level for the first time in several weeks and closed at a robust 57.74.
And the Index's MACD signal, which has been locked in a torturous downtrend for most of the last 3 months, rebounded from negative territory and added 5.81 points to close at a modest 0.4. More importantly, MACD saw its fast blue line cross up and over its slow moving red line, a bullish technical event that usually signals at least a short-term trend change.
The Index's rebound was all the more impressive when you consider it blew straight through the 20 and 50 day moving averages (at 1191-1120) which hung above it, a level that ought to have provided some resistance.
The Index 's new support levels are at 1120 and 1100. 1140 and 1150 remain challenging resistance, as those 2016 highs have not held for long on the two September rallies that drove the Index to those lofty levels.
Momentum has now swung in favour of the bulls and another rally to those 1140 or 1150 levels would not be out of the question over the next 7 to 10 days. Looking out a little further, the US Presidential Election on November 8 is likely to increase investor uncertainty and volatility and will be a major test for the Index's mettle.
Despite the Index's dramatic swings since July, the big picture suggests the Index remains in a sideways consolidation pattern (between 1100 and 1150) which began after a monster 250-point rally from its January lows.
Running sneakers | adidas Campus 80s South Park Towelie - GZ9177
Category:
- Please sign in or create an account to leave comments
Please make the indicated changes including the new text: US quotes snapshot data provided by IEX. Additional price data and company information powered by Twelve Data.