
INK Canadian Insider Index fights to hold onto 1100 level
Thank you for joining us in a weekly technical look at the mid-cap oriented INK Canadian Insider (CIN) Index. The Index which had shown some signs of optimism recently, had a thoroughly disappointing week as it sliced easily through its 50-and 20-day moving averages, and closed down 2% for a 24 point loss at 1103.70.
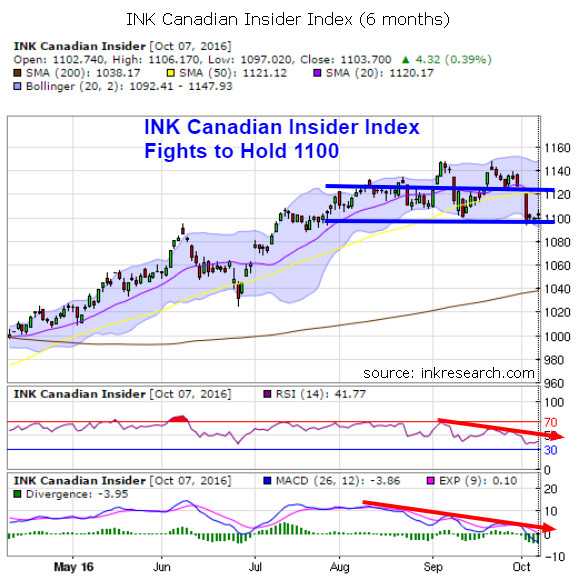
Our short term momentum indicator RSI fell out of the top bunk, as it dropped 25% or 10 points and relinquished its hold of the key 50-point level, closing the week at 41.77.
In our last update, we observed that our longer term momentum indicator MACD was showing a small upward break of its two-month downtrend. A couple more weeks of strength, we suggested, could send it sailing higher. However, that upward break would not hold for long. The Index's MACD signal, which has spent very little time above single digits since January, quickly rolled over and plunged more than 7 points to close at -3.86.
The Index's main support now lies in the 1100/1083 area. Below that, support is next found at 1038. A stiff-looking wall of resistance can be seen at 1120 where its 50- and 20-day moving averages are currently converging. Above that, the 1140 level has capped most recent rallies.
What is positive after the recent rout is that the 1100 level has kept the Index afloat and alive to fight another day. It seems likely we'll see the Index stage a rebound from its oversold condition. The question is - will resistance at 1120 cap its advance, or has this sell-off generated enough pessimism to generate a strong enough advance to return the Index to its previous high levels?
Category:
- Please sign in or create an account to leave comments
Please make the indicated changes including the new text: US quotes snapshot data provided by IEX. Additional price data and company information powered by Twelve Data.