
SEMAFO Delivers Cash Flow from Operations of $23.6 Million in Second Quarter 2017
SEMAFO Delivers Cash Flow from Operations of $23.6 Million in Second Quarter 2017
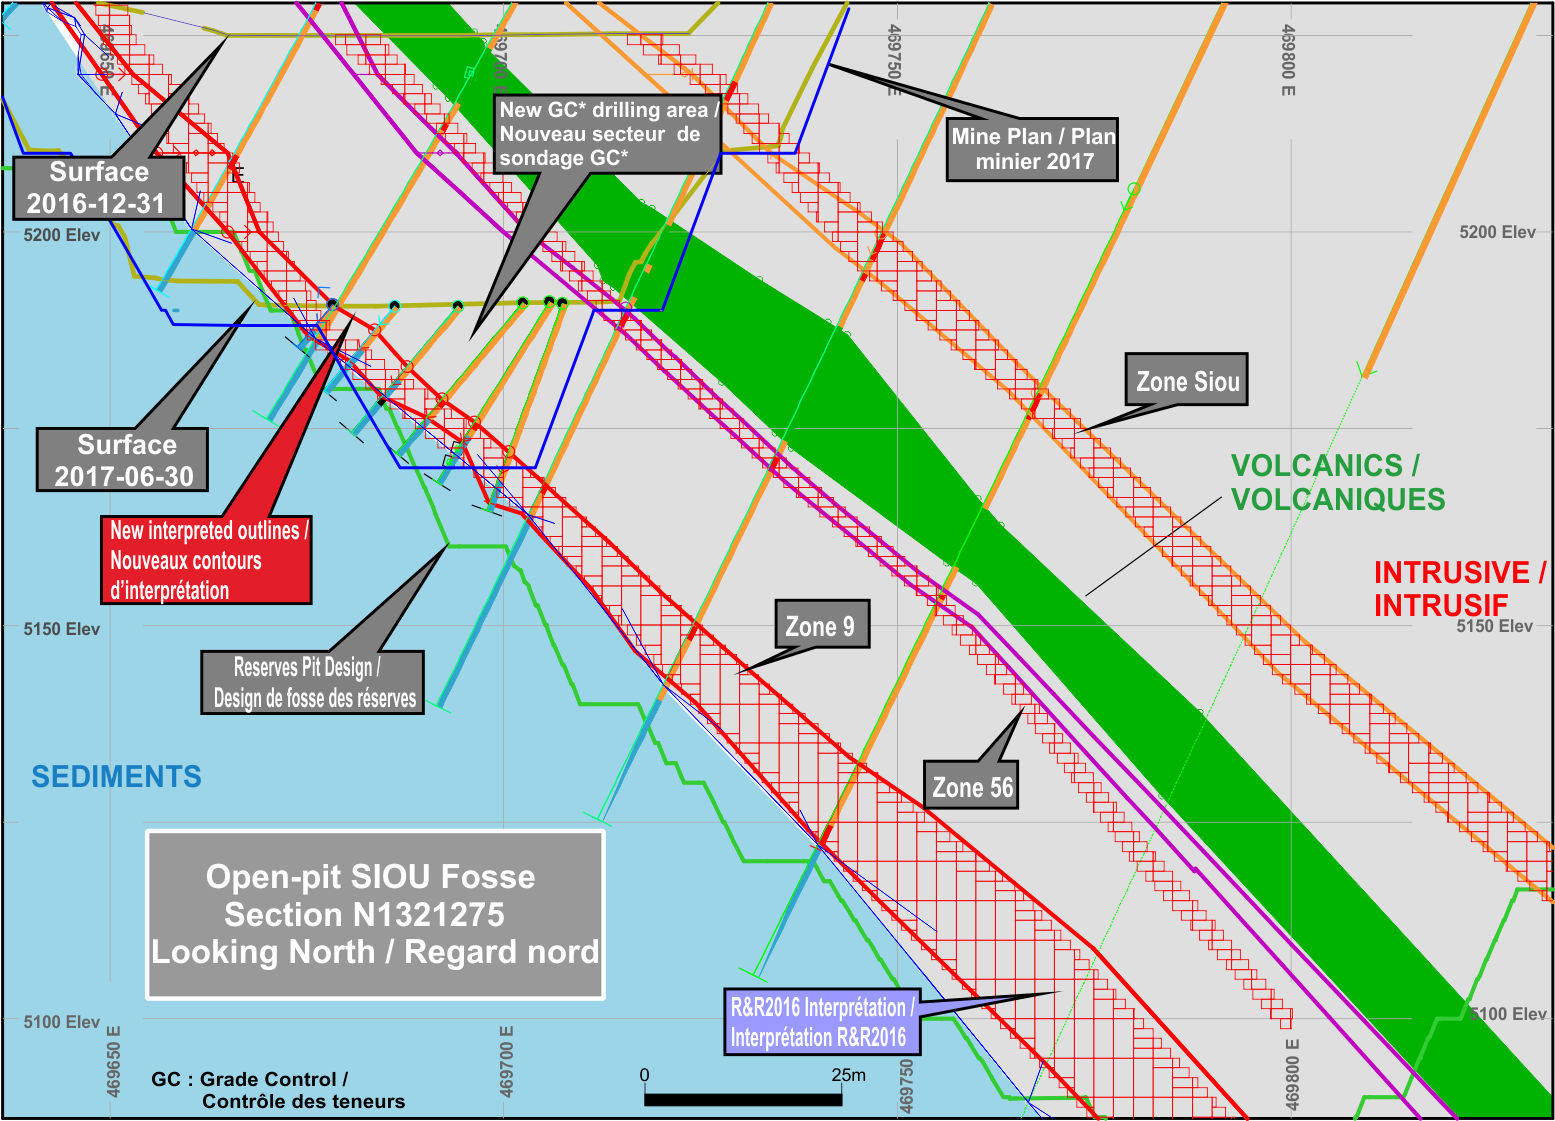
Results from Zone 9 Grade Control Program in Line with 2016 Reserves
MONTREAL, QUEBEC--(Marketwired - Aug. 9, 2017) - SEMAFO Inc. (TSX:SMF)(OMX:SMF) today reported its financial and operational results for the three-month period ended June 30, 2017. All amounts are in US dollars unless otherwise stated.
Second Quarter 2017 - in Review
- Results from grade control program on Zone 9 are in line with 2016 reserves
- Gold production of 47,600 ounces compared to 61,300 ounces for the same period in 2016
- Gold sales of $59.3 million compared to $76.6 million for the same period in 2016
- Total cash cost1 of $703 per ounce sold and all-in sustaining cost1 of $1,074 per ounce sold compared to $547 and $742, respectively, for the same period in 2016
- Net operating loss of $0.8 million compared to an operating income of $14.4 million for the same period in 2016
- Adjusted operating loss1 of $2.8 million compared to an adjusted operating income of $18.9 million for the same period in 2016
- Net income of $9.3 million compared to $7.1 million for the same period in 2016
- Adjusted net loss attributable to equity shareholders1 of 2.9 million or $0.01 loss per share1 compared to an adjusted net income of $14.4 million or $0.05 per share1 for the same period in 2016
- Cash flows from operating activities2 of $23.6 million or $0.07 per share1 compared to $37.4 million or $0.12 per share1 for the same period in 2016
- Drawdown of incremental $60 million from Credit Facility with Macquarie Bank Limited in June
| 1 | Total cash cost, all-in sustaining cost, adjusted operating income (loss), adjusted net income (loss) attributable to equity shareholders, adjusted basic earnings (loss) per share and operating cash flows per share are non-IFRS financial performance measures with no standard definition under IFRS. See the "Non-IFRS financial performance measures" section of the Corporation's MD&A, note 18. |
| 2 | Cash flows from operating activities exclude changes in non-cash working capital items. |
Boungou Mine
- Development on schedule with $69 million spent out of $231 million
- Construction of the mine 35% complete
- Pre-stripping at Boungou deposit has commenced
- Water storage facility has been excavated and is ready to collect 2017 rainwater
- 1.1 million man-hours have been worked without lost-time injury
Grade Control Results at Siou
Earlier this year, the mined grade was adversely affected by the geological interpretation of the upper portion of Zone 9, a mineralized zone in the south-west sector of the Siou pit that was first included in the 2017 mine plan. The upper portion of Zone 9 presents a complex geometry as the area comprises the junction of three different zones: Zone 9 itself, and two subsidiary zones known as Zones 55 and 56. This resulted in misleading ore outlines and led to significant variation in grade.
Following these issues, the Corporation changed its method of grade control from channel sampling to reverse-circulation (RC) drilling. We are now pleased to be in a position to provide grade control results for Zone 9. As at end of July, over 7,500 meters (in 200 holes) of in-pit RC drilling had been conducted to a vertical depth of up to 30 meters over 500 meters of mineralization over a grid of 12.5 meters by 6.25 meters in the Zone 9 area. This represents the ore expected to be mined from Zone 9 from May through December 2017. As shown in Figure 1, the results from the grade control program are in line with our 2016 reserves and confirm our expectation that the geometry is simpler and more rectilinear.
Table 1 below compares the new block model with the 2016 reserves block model for the same test area of Zone 9.
Table 1
| New block model (Mining area: May through December 2017) |
668,000 tonnes at 4.52 g/t Au for 97,000 oz of gold contained |
| 2016 reserves block model | 633,500 tonnes at 4.82 g/t Au for 98,100 oz of gold contained |
As expected, we exited the complex portion of upper Zone 9 in May. The ore mined in the months of May and June is in line with our new block model.
The Corporation reiterates its 2017 outlook of between 190,000 and 205,000 ounces of gold, at a total cash cost of between $685 and $715 per ounce and all-in sustaining cost of between $920 and $960 per ounce.
To see the figure associated with this press relelase, please click on the following link: http://media3.marketwire.com/docs/1100524_FIGURE1.jpg
Mana, Burkina Faso
Mining Operations
| Three-month period | Six-month period | ||||||||
| ended June 30, | ended June 30, | ||||||||
| 2017 | 2016 | Variation | 2017 | 2016 | Variation | ||||
| Operating Data | |||||||||
| Ore mined (tonnes) | 503,200 | 564,500 | (11 | %) | 982,600 | 1,064,800 | (8 | %) | |
| Ore processed (tonnes) | 675,500 | 604,500 | 12 | % | 1,407,300 | 1,287,400 | 9 | % | |
| Waste mined (tonnes) | 3,947,600 | 4,809,700 | (18 | %) | 8,586,000 | 8,269,100 | 4 | % | |
| Operational stripping ratio | 7.8 | 8.5 | (8 | %) | 8.7 | 7.8 | 12 | % | |
| Head grade (g/t) | 2.31 | 3.33 | (31 | %) | 2.43 | 3.18 | (24 | %) | |
| Recovery (%) | 95 | 95 | - | 94 | 93 | 1 | % | ||
| Gold ounces produced | 47,600 | 61,300 | (22 | %) | 103,000 | 122,600 | (16 | %) | |
| Gold ounces sold | 46,900 | 60,700 | (23 | %) | 101,600 | 123,500 | (18 | %) | |
| Statistics (in dollars) | |||||||||
| Average realized selling price (per ounce). | 1,265 | 1,262 | - | 1,242 | 1,224 | 1 | % | ||
| Cash operating cost (per tonne processed)1 | 43 | 49 | (12 | %) | 48 | 46 | 4 | % | |
| Total cash cost (per ounce sold)1 | 703 | 547 | 29 | % | 701 | 526 | 33 | % | |
| All-in sustaining cost (per ounce sold)1 | 1,074 | 742 | 45 | % | 976 | 719 | 36 | % | |
| Depreciation (per ounce sold)² | 527 | 331 | 59 | % | 491 | 303 | 62 | % | |
| 1 | Cash operating cost, total cash cost and all-in sustaining cost are non-IFRS financial performance measures with no standard definition under IFRS. See the "Non-IFRS financial performance measures" section of the Corporation's MD&A, note 18. |
| 2 | Depreciation per ounce sold is a non-IFRS financial performance measure with no standard definition under IFRS and represents the depreciation expense per ounce sold. |
2017 Second Quarter Results
As expected, grade in the quarter was adversely affected by the geological interpretation of the upper portion of Zone 9. Consequently, production in the second quarter totaled 47,600 ounces of gold compared to 61,300 ounces in the prior-year quarter. During the second quarter of 2017, the ore processed was 675,500 tonnes at an average grade of 2.31 g/t Au, including 194,100 tonnes of low-grade material not included in our reserves. The latter results from a decision to take advantage of higher gold prices and available milling capacity in order to generate additional cash flow. Absent the impact of this decision, the head grade would have been 2.94 g/t Au. The decrease in gold ounces produced and sold is a direct result of lower head grade, partially offset by higher throughput.
The Corporation's second quarter gold sales decreased relative to 2016 due to lower gold ounces sold, and resulted in a decrease in government royalties. The 2017 increase in depreciation of property, plant and equipment mainly reflects a higher capitalized stripping ratio from Siou at depth compared to the same period in 2016. Second quarter operating income decreased compared to the same period in 2016, primarily as a result of lower gold sales and higher depreciation, partially offset by lower share-based compensation expense. The decrease in cash flow from operating activities in the quarter compared to the same period in 2016 is due to lower gold sales following a decrease in production.
In the second quarter of 2017, our cash operating cost per tonne processed totaled $43 compared to $49 in the prior year. The decrease is attributable to a lower operational stripping ratio combined with higher throughput compared to 2016. The total cash cost and all-in sustaining cost reached $703 and $1,074 per ounce sold, respectively, compared to $547 and $742 per ounce sold, respectively, for the same period in 2016. The 2017 cost results are due to the lower head grade, partially offset by a lower cash operating cost per tonne.
Boungou Mine
To date, construction of the Boungou Mine is progressing well and is on time and on budget. As at June 30, 2017, the following key components had been advanced:
- Development on schedule, with $69 million spent
- Construction of the mine 35% complete
- Concrete works are progressing on the SAG, vertimill, crusher and surge bin foundations
- Erection of the leach and water tanks has commenced
- On-site delivery of the vertimill, the first long-lead item
- Work has commenced on the power plant and fuel depot
- Water storage facility has been excavated and is ready to collect 2017 rainwater
- Pre-stripping at the Boungou deposit has commenced
- Receipt of the mining convention from the Council of Ministers of the Government of Burkina Faso
- 1,540 personnel including contractors were employed on site, 93% of which are Burkinabe
- 1.1 million man-hours have been worked without lost-time injury
Exploration
Mana Project, Burkina Faso
Exploration drilling at Mana in the quarter targeted the Siou deposit at depth. Year to date, a total of 49 holes (17,400 meters) mainly tested the southern part of the Siou mineralized structures at depth up to 50-meter by 50-meter spacing, including 8 holes (2,800 meters) for geotechnical studies. The delineation program was completed in July 2017. The objectives of this program are to expand the resources at Siou, convert inferred resources into the indicated category and complete a pre-feasibility study in the first quarter of 2018.
Under the regional program, a total of 32,780 meters of auger drilling was carried out in the first half of the year over the Mana Ouest, Fobiri II and Bara permits.
Tapoa (Boungou Mine)
West and East Flank Sectors
In the second quarter, exploration activities principally involved completion of the infill program (40-meter by 40-meter spacing) on the West and East Flank Sectors of the Boungou reserves pit. A total of 49,400 meters of drilling in 326 holes was carried out in the first half of the year, most of which was for the infill program, with the objective of bringing the inferred resources into the indicated resources category in order to complete a pre-feasibility study in the first quarter of 2018. Results continue to be in line with the 80-meter x 80-meter model. The East Flank, although much smaller, has a similar structure to that of the West Flank.
The geotechnical drilling program on the East and West Flanks has also been completed, and samples have been sent to Rocklab in South Africa to establish engineering parameters. Results are expected in the third quarter of 2017. Analysis of the rock mechanics will be used in the design of the underground stoping in the pre-feasibility study.
Regional Exploration
In the second quarter, a 60,000-meter auger drill program was initiated on the Bossoari, Dangou and Pambourou permits located within the Tapoa Project. In 2016, a soil sampling program was conducted on the Bossoari permit located southwest of the Boungou permit. A total of 22,000 meters was drilled in 2,375 holes on the three properties in the quarter, and results will be used to define RC drill targets later in the year.
Exploration RC drilling commenced at the beginning of June to test auger drill anomalies along the 045 Trend and the Bossoari target. To date, 32 holes (1,450 meters, part of the above 49,400 meters of infill drilling) have been completed.
Kongolokoro (Houndé Greenstone Belt)
Exploration activities commenced in the quarter on the Milpo permit where a 6,700-meter RC drill program was conducted in 67 holes. The program is now complete, and no significant results were reported.
In July, a 1,200-meter core drill program was initiated on the Dynikongolo permit with the aim of finding extensions to the Bantou mineralized zone.
Korhogo Ouest (Côte d'Ivoire)
A first trenching exploration program commenced in March this year on our Korhogo Ouest permit in Côte d'Ivoire located at some 60 kilometers from the Tongon Mine. The program follows up the airborne geophysical and soil geochemical surveys completed in 2016. A total of 11 trenches has been completed, mapped and sampled (2,011 meters for 2,173 samples). Following encouraging trenching results, a 6,000-meter RC drilling program commenced in July.
SEMAFO's Management's Discussion and Analysis, Consolidated Financial Statements and related financial materials are available in the "Investor Relations" section of the Corporation's website at www.semafo.com. These and other corporate reports are also available on www.sedar.com.
Second Quarter Conference Call
A conference call will be held today, Wednesday, August 9, 2017 at 10:00 EDT to discuss this press release. Interested parties are invited to call the following telephone numbers to participate in the conference:
| Tel. local & overseas: | +1 (647) 788 4922 |
| Tel. North America: | 1 (877) 223 4471 |
| Webcast: | http://www.semafo.com/ |
| Replay number: | 1 (800) 585 8367 or +1 (416) 621 4642 |
| Replay pass code: | 48335908 |
| Replay expiration: | August 30, 2017 |
About SEMAFO
SEMAFO is a Canadian-based mining company with gold production and exploration activities in West Africa. The Corporation operates the Mana Mine in Burkina Faso, which includes the high-grade satellite deposit of Siou, and is targeting production start-up of the Boungou Mine in the third quarter of 2018. SEMAFO's strategic focus is to maximize shareholder value by effectively managing its existing assets as well as pursuing organic and strategic growth opportunities.
CAUTION CONCERNING FORWARD-LOOKING STATEMENTS
This press release contains forward-looking statements. Forward-looking statements involve known and unknown risks, uncertainties and assumptions and accordingly, actual results and future events could differ materially from those expressed or implied in such statements. You are hence cautioned not to place undue reliance on forward-looking statements. Forward-looking statements include words or expressions such as "expected", "outlook", "objectives", "will", "aim", "encouraging", "targeting", "pursuing", "growth", "opportunities" and other similar words or expressions. Factors that could cause future results or events to differ materially from current expectations expressed or implied by the forward-looking statements include the ability to mine the expected ore from Zone 9 from May through December 2017, the accuracy of our new block model, the ability to meet our 2017 gold outlook of between 190,000 and 205,000 ounces of gold at a total cash cost of between $685 and $715 per ounce and all-in sustaining cost of between $920 and $960 per ounce, the ability to expand the resources at Siou, convert inferred resources into the indicated category and complete a pre-feasibility study in the first quarter of 2018, the ability to bring the inferred resources into the indicated resources category in order to complete a pre-feasibility study in the first quarter of 2018 at Natougou, the ability of the 1,200-meter core drill program on the Dynikongolo permit to find extensions to the Bantou mineralized zone, the accuracy of our assumptions, the ability to execute on our strategic focus, fluctuation in the price of currencies, gold prices and operating costs, mining industry risks, uncertainty as to calculation of mineral reserves and resources, delays, political and social stability in Africa (including our ability to maintain or renew licenses and permits) and other risks described in SEMAFO's documents filed with Canadian securities regulatory authorities. You can find further information with respect to these and other risks in SEMAFO's 2016 Annual MD&A, as updated in SEMAFO's 2017 First Quarter MD&A, 2017 Second Quarter MD&A, and other filings made with Canadian securities regulatory authorities and available at www.sedar.com. These documents are also available on our website at www.semafo.com. SEMAFO disclaims any obligation to update or revise these forward-looking statements, except as required by applicable law.
The information in this release is subject to the disclosure requirements of SEMAFO under the Swedish Securities Market Act and/or the Swedish Financial Instruments Trading Act. This information was publicly communicated on August 9, 2017 at 7:00 a.m., Eastern Daylight Time.
Consolidated Results and Mining Operations
Financial and Operating Highlights
| Three-month period | Six-month period | |||||||||||||
| ended June 30, | ended June 30, | |||||||||||||
| 2017 | 2016 | Variation | 2017 | 2016 | Variation | |||||||||
| Gold ounces produced | 47,600 | 61,300 | (22 | %) | 103,000 | 122,600 | (16 | %) | ||||||
| Gold ounces sold | 46,900 | 60,700 | (23 | %) | 101,600 | 123,500 | (18 | %) | ||||||
| (in thousands of dollars, except amounts per share) | ||||||||||||||
| Revenues - Gold sales | 59,315 | 76,590 | (23 | %) | 126,201 | 151,146 | (17 | %) | ||||||
| Mining operation expenses | 30,573 | 30,071 | 2 | % | 66,138 | 58,793 | 12 | % | ||||||
| Government royalties | 2,389 | 3,139 | (24 | %) | 5,081 | 6,157 | (17 | %) | ||||||
| Depreciation of property, plant and equipment | 24,795 | 20,164 | 23 | % | 50,063 | 37,504 | 33 | % | ||||||
| Share-based compensation | (1,095 | ) | 5,127 | - | 124 | 8,805 | (99 | %) | ||||||
| Other | 3,408 | 3,661 | (7 | %) | 7,335 | 7,623 | (4 | %) | ||||||
| Operating income (loss) | (755 | ) | 14,428 | - | (2,540 | ) | 32,264 | - | ||||||
| Finance income | (800 | ) | (573 | ) | 40 | % | (1,536 | ) | (946 | ) | 62 | % | ||
| Finance costs | 321 | 1,062 | (70 | %) | 645 | 1,364 | (53 | %) | ||||||
| Foreign exchange (gain) loss | (6,103 | ) | 2,714 | - | (6,932 | ) | (2,195 | ) | 216 | % | ||||
| Income tax expense (recovery) | (3,521 | ) | 4,147 | - | (1,681 | ) | 8,272 | - | ||||||
| Net income for the period | 9,348 | 7,078 | 32 | % | 6,964 | 25,769 | (73 | %) | ||||||
| Attributable to equity shareholders | ||||||||||||||
| Net income | 8,854 | 5,304 | 67 | % | 6,163 | 21,488 | (71 | %) | ||||||
| Basic earnings per share | 0.03 | 0.02 | 50 | % | 0.02 | 0.07 | (71 | %) | ||||||
| Diluted earnings per share | 0.03 | 0.02 | 50 | % | 0.02 | 0.07 | (71 | %) | ||||||
| Adjusted amounts | ||||||||||||||
| Adjusted operating income (loss)1 | (2,754 | ) | 18,911 | - | (4,643 | ) | 38,984 | - | ||||||
| Adjusted net income (loss) attributable to equity shareholders1 | (2,893 | ) | 14,394 | - | (7,267 | ) | 25,355 | - | ||||||
| Per share1 | (0.01 | ) | 0.05 | - | (0.02 | ) | 0.08 | - | ||||||
| Cash flows | ||||||||||||||
| Cash flows from operating activities ² | 23,614 | 37,390 | (37 | %) | 46,761 | 72,594 | (36 | %) | ||||||
| Per share1 | 0.07 | 0.12 | (42 | %) | 0.14 | 0.24 | (42 | %) | ||||||
| 1 | Adjusted operating income (loss), adjusted net income (loss) attributable to equity shareholders, adjusted basic earnings (loss) per share and operating cash flows per share are non-IFRS financial performance measures with no standard definition under IFRS. See the "Non-IFRS financial measures" section of the Corporation's MD&A, note 18. |
| 2 | Cash flows from operating activities exclude changes in non-cash working capital items. |
| Interim Consolidated Statement of Financial Position |
| (Expressed in thousands of US dollars - unaudited) |
| As at | As at | |
| June 30, | December 31, | |
| 2017 | 2016 | |
| $ | $ | |
| Assets | ||
| Current assets | ||
| Cash and cash equivalents | 283,297 | 273,772 |
| Trade and other receivables | 23,952 | 16,945 |
| Inventories | 47,006 | 51,391 |
| Other current assets | 3,946 | 2,513 |
| 358,201 | 344,621 | |
| Non-current assets | ||
| Advance receivable | 3,028 | 3,060 |
| Restricted cash | 21,191 | 5,689 |
| Property, plant and equipment | 585,222 | 536,237 |
| Intangible asset | 1,481 | 1,595 |
| Other non-current assets | 1,434 | 4,074 |
| 612,356 | 550,655 | |
| Total assets | 970,557 | 895,276 |
| Liabilities | ||
| Current liabilities | ||
| Trade payables and accrued liabilities | 61,262 | 41,964 |
| Current portion of long-term debt | 310 | 310 |
| Share unit plans liabilities | 4,695 | 6,635 |
| Provisions | 3,230 | 3,271 |
| Income tax payable | 1,953 | 5,422 |
| 71,450 | 57,602 | |
| Non-current liabilities | ||
| Long-term debt | 114,241 | 56,726 |
| Share unit plans liabilities | 1,745 | 4,899 |
| Provisions | 9,748 | 8,137 |
| Deferred income tax liabilities | 30,426 | 32,329 |
| 156,160 | 102,091 | |
| Total liabilities | 227,610 | 159,693 |
| Equity | ||
| Equity Shareholders | ||
| Share capital | 621,996 | 621,902 |
| Contributed surplus | 7,324 | 7,357 |
| Accumulated other comprehensive income | 1,434 | 1,095 |
| Retained earnings | 83,837 | 77,674 |
| 714,591 | 708,028 | |
| Non-controlling interest | 28,356 | 27,555 |
| Total equity | 742,947 | 735,583 |
| Total liabilities and equity | 970,557 | 895,276 |
| Interim Consolidated Statement of Income |
| (Expressed in thousands of US dollars, except per share amounts - unaudited) |
| Three-month period | Six-month period | ||||||||
| ended June 30, | ended June 30, | ||||||||
| 2017 | 2016 | 2017 | 2016 | ||||||
| $ | $ | $ | $ | ||||||
| Revenue - Gold sales | 59,315 | 76,590 | 126,201 | 151,146 | |||||
| Costs of operations | |||||||||
| Mining operation expenses | 32,962 | 33,210 | 71,219 | 64,950 | |||||
| Depreciation of property, plant and equipment | 24,795 | 20,164 | 50,063 | 37,504 | |||||
| General and administrative | 3,329 | 3,481 | 6,871 | 7,308 | |||||
| Corporate social responsibility expenses | 79 | 180 | 464 | 315 | |||||
| Share-based compensation | (1,095 | ) | 5,127 | 124 | 8,805 | ||||
| Operating income (loss) | (755 | ) | 14,428 | (2,540 | ) | 32,264 | |||
| Other expenses (income) | |||||||||
| Finance income | (800 | ) | (573 | ) | (1,536 | ) | (946 | ) | |
| Finance costs | 321 | 1,062 | 645 | 1,364 | |||||
| Foreign exchange (gain) loss | (6,103 | ) | 2,714 | (6,932 | ) | (2,195 | ) | ||
| Income before income taxes | 5,827 | 11,225 | 5,283 | 34,041 | |||||
| Income tax expense (recovery) | |||||||||
| Current | 514 | 6,611 | 2,235 | 10,565 | |||||
| Deferred | (4,035 | ) | (2,464 | ) | (3,916 | ) | (2,293 | ) | |
| (3,521 | ) | 4,147 | (1,681 | ) | 8,272 | ||||
| Net income for the period | 9,348 | 7,078 | 6,964 | 25,769 | |||||
| Attributable to: | |||||||||
| Equity shareholders | 8,854 | 5,304 | 6,163 | 21,488 | |||||
| Non-controlling interests | 494 | 1,774 | 801 | 4,281 | |||||
| 9,348 | 7,078 | 6,964 | 25,769 | ||||||
| Earnings per share | |||||||||
| Basic | 0.03 | 0.02 | 0.02 | 0.07 | |||||
| Diluted | 0.03 | 0.02 | 0.02 | 0.07 | |||||
| Interim Consolidated Statement of Comprehensive Income |
| (Expressed in thousands of US dollars - unaudited) |
| Three-month period | Six-month period | ||||||
| ended June 30, | ended June 30, | ||||||
| 2017 | 2016 | 2017 | 2016 | ||||
| $ | $ | $ | $ | ||||
| Net income for the period | 9,348 | 7,078 | 6,964 | 25,769 | |||
| Other comprehensive income | |||||||
| Item that may be classified to net income | |||||||
| Change in fair value of the investment in GoviEx (net of tax of nil) | (479 | ) | - | 339 | - | ||
| Total comprehensive income for the period, net of tax | 8,869 | 7,078 | 7,303 | 25,769 | |||
| Attributable to: | |||||||
| Equity shareholders | 8,375 | 5,304 | 6,502 | 21,488 | |||
| Non-controlling interest | 494 | 1,774 | 801 | 4,281 | |||
| 8,869 | 7,078 | 7,303 | 25,769 | ||||
| Interim Consolidated Statement of Cash Flows |
| (Expressed in thousands of US dollars - unaudited) |
| Three-month period | Six-month period | |||||||||
| ended June 30, | ended June 30, | |||||||||
| 2017 | 2016 | 2017 | 2016 | |||||||
| $ | $ | $ | $ | |||||||
| Cash flows from (used in): | ||||||||||
| Operating activities | ||||||||||
| Net income for the period | 9,348 | 7,078 | 6,964 | 25,769 | ||||||
| Adjustments for: | ||||||||||
| Depreciation of property, plant and equipment | 24,795 | 20,164 | 50,063 | 37,504 | ||||||
| Share-based compensation | (1,095 | ) | 5,127 | 124 | 8,805 | |||||
| Unrealized foreign exchange loss (gain) | (5,331 | ) | 1,862 | (6,339 | ) | (2,928 | ) | |||
| Deferred income tax expense (recovery) | (4,035 | ) | (2,464 | ) | (3,916 | ) | (2,293 | ) | ||
| Adjustment for withholding taxes | - | 5,827 | - | 5,827 | ||||||
| Other | (68 | ) | (204 | ) | (135 | ) | (90 | ) | ||
| 23,614 | 37,390 | 46,761 | 72,594 | |||||||
| Changes in non-cash working capital items | (2,842 | ) | (3,578 | ) | (8,594 | ) | 3,187 | |||
| Net cash provided by operating activities | 20,772 | 33,812 | 38,167 | 75,781 | ||||||
| Financing activities | ||||||||||
| Drawdown (Repayment) of long-term debt | 59,921 | - | 59,845 | (30,000 | ) | |||||
| Long-term debt transaction costs | - | (259 | ) | - | (259 | ) | ||||
| Proceeds on issuance of share capital, net of expenses | 12 | 87,238 | 61 | 88,643 | ||||||
| Dividend paid by a subsidiary to non-controlling interest | - | (10,359 | ) | - | (10,359 | ) | ||||
| Net cash provided by financing activities | 59,933 | 76,620 | 59,906 | 48,025 | ||||||
| Investing activities | ||||||||||
| Acquisitions of property, plant and equipment | (43,864 | ) | (20,397 | ) | (81,096 | ) | (39,940 | ) | ||
| Increase in restricted cash | (15,077 | ) | - | (15,077 | ) | - | ||||
| Net cash used in investing activities | (58,941 | ) | (20,397 | ) | (96,173 | ) | (39,940 | ) | ||
| Effect of exchange rate changes on cash and cash equivalents | 6,372 | (2,632 | ) | 7,625 | 3,038 | |||||
| Change in cash and cash equivalents during the period | 28,136 | 87,403 | 9,525 | 86,904 | ||||||
| Cash and cash equivalents - beginning of period | 255,161 | 166,667 | 273,772 | 167,166 | ||||||
| Cash and cash equivalents - end of period | 283,297 | 254,070 | 283,297 | 254,070 | ||||||
| Interest paid | 892 | 910 | 1,780 | 2,492 | ||||||
| Interest received | 693 | 493 | 1,132 | 854 | ||||||
| Income tax paid | 3,506 | 6,088 | 5,667 | 6,173 | ||||||
SEMAFO Inc.
Robert LaValliere
Vice-President, Corporate Affairs & Investor Relations
Email: [email protected]
Cell: +1 (514) 240 2780
Ruth Hanna
Analyst, Investor Relations
Email: [email protected]
Tel. local & overseas: +1 (514) 744 4408
North America Toll-Free: 1 (888) 744 4408
www.semafo.com
Please make the indicated changes including the new text: US quotes snapshot data provided by IEX. Additional price data and company information powered by Twelve Data.