
Dream Office REIT Reports Q3 2021 Results
DREAM OFFICE REAL ESTATE INVESTMENT TRUST (D.UN-TSX) or (“Dream Office REIT”, the “Trust” or “we”) today announced its financial results for the three and nine months ended September 30, 2021 and provided a business update related to the COVID-19 pandemic.
This press release features multimedia. View the full release here: https://www.businesswire.com/news/home/20211104006374/en/
Q3 2021 - Revenue by Tenant Industry (Graphic: Business Wire)
OPERATIONAL HIGHLIGHTS
(unaudited) |
As at |
||||||||||
|
September 30, |
|
|
|
June 30, |
|
|
|
September 30, |
||
|
|
2021 |
|
|
|
2021 |
|
|
|
2020 |
|
Total properties(1) |
|
|
|
|
|
|
|
|
|||
Number of active properties |
|
29 |
|
|
28 |
|
|
28 |
|||
Number of properties under development |
|
1 |
|
|
2 |
|
|
2 |
|||
Gross leasable area (“GLA”) (in millions of sq. ft.) |
|
5.5 |
|
|
5.5 |
|
|
5.5 |
|||
Investment properties value |
$ |
2,553,395 |
|
$ |
2,483,301 |
|
$ |
2,458,246 |
|||
Total portfolio(2) |
|
|
|
|
|
|
|
|
|||
Occupancy rate – including committed (period-end) |
|
84.6% |
|
|
85.6% |
|
|
88.0% |
|||
Occupancy rate – in-place (period-end) |
|
82.7% |
|
|
83.9% |
|
|
87.8% |
|||
Average in-place and committed net rent per square foot (period-end) |
$ |
23.08 |
|
$ |
23.18 |
|
$ |
23.15 |
|||
Weighted average lease term (“WALT”) (years) |
|
5.2 |
|
|
5.0 |
|
|
5.1 |
|||
See footnotes at end. |
|||||||||||
|
|
Three months ended |
|
|
|
Nine months ended |
|||||||||
|
|
September 30, |
|
|
|
September 30, |
|
|
|
September 30, |
|
|
|
September 30, |
|
|
|
2021 |
|
|
|
2020 |
|
|
|
2021 |
|
|
|
2020 |
|
Operating results |
|
|
|
|
|
|
|
|
|
|
|
||||
Net income |
$ |
91,716 |
|
$ |
39,294 |
|
$ |
127,326 |
|
$ |
161,725 |
||||
Funds from operations (“FFO”)(3) |
|
23,208 |
|
|
23,088 |
|
|
65,864 |
|
|
70,306 |
||||
Net rental income |
|
27,327 |
|
|
27,890 |
|
|
80,612 |
|
|
84,997 |
||||
Comparative properties net operating income (“NOI”)(3) |
|
27,351 |
|
|
30,519 |
|
|
83,347 |
|
|
92,527 |
||||
Per unit amounts |
|
|
|
|
|
|
|
|
|
|
|
||||
FFO (diluted)(3)(4) |
$ |
0.41 |
|
$ |
0.38 |
|
$ |
1.16 |
|
$ |
1.14 |
||||
Distribution rate |
|
0.25 |
|
|
0.25 |
|
|
0.75 |
|
|
0.75 |
||||
See footnotes at end. |
|||||||||||||||
“The COVID-19 pandemic has lasted much longer than expected which has affected our building occupancy over the past 20 months, but we are collecting rents, renewing tenants and doing some new lease deals. Increased traffic in downtown Toronto and at our buildings suggests that we are approaching the end of the pandemic and we expect to see this trend continue. We have used our time during COVID to improve our portfolio and believe our tenants will be very pleased when they come to our buildings,” said Michael J. Cooper, Chief Executive Officer of Dream Office REIT. “We have also made progress on our development plans which continue to add value to the business. During the pandemic our core investment property values have held steady and we have recognized development property gains. Our net asset value has continued to increase and our investment in Dream Industrial REIT, which has grown to 35% of our market cap, is a meaningful contributor to our earnings metrics. While there continues to be uncertainty in the office sector, we are confident that we will benefit from the portfolio of office buildings we have created, our development sites and our investment in Dream Industrial REIT.”
- Net income for the quarter and year-to-date: For the three and nine months ended September 30, 2021, the Trust generated net income of $91.7 million and $127.3 million, respectively. Included in net income for the three and nine months ended September 30, 2021 are positive fair value adjustments to investment properties totalling $58.0 million and $48.2 million, respectively, due to increases in value at Eglinton & Birchmount, reflecting nearby comparable property sales, and, to a lesser extent, our completed development at 1900 Sherwood Place. In addition, for the three and nine months ended September 30, 2021 negative fair value adjustments to financial instruments totalled $0.5 million and $19.6 million, respectively, primarily attributed to the revaluation of the subsidiary redeemable units.
-
Diluted FFO per unit(3)(4) for the quarter and year-to-date: For the three months ended September 30, 2021, diluted FFO per unit increased by $0.03 per unit to $0.41 per unit relative to $0.38 per unit in Q3 2020 as NOI from our completed developments at 357 Bay Street in Toronto downtown and 1900 Sherwood Place in Regina (+$0.04), the effect of accretive unit repurchases under our Normal Course Issuer Bid (“NCIB”) program in the current and prior year (+$0.03), higher FFO from our investment in Dream Industrial REIT (+$0.02) and improvements in COVID-related provisions and adjustments (+$0.01) were partially offset by lower comparative properties NOI (-$0.06), primarily as a result of the ongoing pandemic, and the effect of a property sale in the prior year (-$0.01).
For the nine months ended September 30, 2021, diluted FFO per unit increased slightly to $1.16 per unit as the effect of accretive unit repurchases under our NCIB program in the current and prior year (+$0.08), NOI from our completed properties under development at 357 Bay Street in Toronto downtown and 1900 Sherwood Place in Regina (+$0.06) higher FFO from our investment in Dream Industrial REIT (+$0.03), improvements in COVID-related provisions and adjustments (+$0.02) and general and administrative expense savings (+$0.01) were partially offset by decreases in comparative properties NOI (-$0.16), primarily as a result of the ongoing pandemic, and other items (-$0.02).
- Net rental income for the quarter and year-to-date: Net rental income for the three and nine months ended September 30, 2021 decreased by $0.6 million and $4.4 million, respectively, relative to the prior year comparative periods primarily due to lower weighted average occupancy, lower transient parking revenues as a result of parking lot closures from city lockdown restrictions across our portfolio, lower rents on renewals and new leases in the Other markets region and a property sale in the prior year. Partially offsetting the year-over-year decreases were net rental income from our completed properties under development at 357 Bay Street in Toronto and 1900 Sherwood Place in Regina, higher net rents on renewals and new leasing in Toronto downtown and investment properties operating expense savings.
-
Comparative properties NOI(3) for the quarter and year-to-date: For the three months ended September 30, 2021, comparative properties NOI decreased by 10.4%, or $3.2 million, over the prior year comparative quarter, primarily driven by a decline in weighted average occupancy in Toronto downtown and lower net rents in Other markets partially offset by higher rents in Toronto downtown. Over the course of the COVID-19 pandemic we have seen significant reductions in leasing activity and building traffic relative to historical norms leading to declines in occupancy and parking income as a result of repeated states of emergency in Toronto. We currently anticipate that many companies will return their employees to the office by the beginning of 2022 and with that leasing activity and traffic flow to our properties will improve and our comparative properties NOI and parking revenues will begin to normalize. During Q3 2021, tour volume returned to pre-COVID levels and towards the end of the quarter we also began to see increased building traffic and parking lot utilization indicating tenants are returning to the office.
For the nine months ended September 30, 2021, comparative properties NOI decreased by 9.9%, or $9.2 million, over the prior year comparative period, primarily driven by a decline in weighted average occupancy and lower parking revenues of $1.1 million across the portfolio as a result of city lockdown restrictions and lower net rents in Other markets, partially offset by rent step-ups and higher rents on lease commencements in Toronto downtown.
We are actively managing our assets in the Toronto downtown region, which represent 82% of our total portfolio investment property fair values, to improve the quality of the buildings and to continue to improve rental rates in this market. For our assets in the Other markets region, which make up the remaining 18% of our total portfolio investment properties fair value, we are repositioning these assets to improve occupancy and liquidity in the private market.
-
In-place occupancy: Total portfolio in-place occupancy on a quarter-over-quarter basis decreased by 1.2% relative to Q2 2021. In Toronto downtown, 122,000 square feet of expiries were partially offset by 31,000 square feet of renewals and 9,000 square feet of new leasing activity. In Toronto downtown, approximately 50,000 square feet, or approximately 1.5% of the region's gross leaseable area, is currently being held intentionally vacant for retail repositioning projects in order to attract premium retail tenants.
In the Other markets region, expiries totalling 25,000 square feet were partially offset by 13,000 square feet of new leases and 8,000 square feet of renewals. Occupancy in Other markets increased as our development at 1900 Sherwood Place in Regina was completed and transferred to active properties on commencement of the Co-operators lease at the property. 1900 Sherwood Place is currently 93.4% occupied with a weighted average lease term of 12.8 years and an average in-place and committed rent of $20.24 per square foot.
Total portfolio in-place occupancy on a year-over-year basis decreased from 87.8% at Q3 2020 to 82.7% this quarter due to net negative absorption partially offset by the reclassification of 1900 Sherwood Place to active properties during the quarter and the reclassification of 357 Bay Street to active properties in Q4 2020.
-
Lease commencements for the quarter and year-to-date: For the three and nine months ended September 30, 2021, approximately 58,000 and 574,000 square feet of leases commenced, respectively, not including temporary leases. The renewal and relocation rate to expiring rate spreads for the three and nine months ended September 30, 2021 were 34.7% and 8.9%, respectively, above expiring rates. For the three months ended September 30, 2021, positive spreads on renewals and relocations in Toronto downtown were 39.6%.
For the nine months ended September 30, 2021, positive leasing spreads on renewals and relocations in Toronto downtown of 11.0% were partially offset by negative leasing spreads on renewals and relocations of 5.7% in the Other markets region. In Toronto downtown, renewals included a 248,000 square feet tenant exercising its option to renew at expiring rates established back in 2010 with no associated leasing costs. Excluding the effect of this renewal option, the increase in net rents on renewals and relocations in Toronto downtown was 27.3%.
-
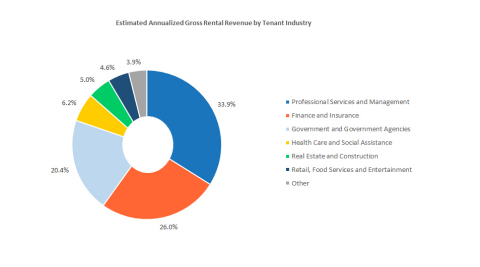
Tenant profile: As illustrated in the chart below, the Trust has a diversified and stable tenant mix.
See Figure 1, Q3 2021 - Revenue by Tenant Industry
Our top ten tenants make up approximately 39% of gross rental revenue, and 50% of our top tenants have credit ratings of A- or higher.
- Completion of 1900 Sherwood Place: The Trust has completed its development project at 1900 Sherwood Place in Regina. The project was completed on time and on budget. On July 1, 2021, 1900 Sherwood Place was transferred to active properties once the tenant took occupancy and commenced paying rent. 1900 Sherwood Place is currently 93.4% occupied with a weighted average lease term of 12.8 years and an average in place rent of $20.24 per square foot.
- Investment in Alate PropTech Venture: In 2018 the Trust took a 25% stake in Alate, a vehicle specializing in real estate technology investments. To date we have invested US$6.6 million to fund 12 investments. On October 19, 2021, Lane Technologies Inc., the developers of a tenant experience app, entered into an agreement to be acquired by VTS at a significant premium to cost. The investment vehicle has generated an IRR of over 40% since inception and is currently exploring raising outside capital. The Trust anticipates it would retain a 25% interest in the managing GP and receive fees from management of the investment vehicle.
-
Environmental, Social & Governance (“ESG”) Update: During 2021 we made our inaugural submission to the Global Real Estate Sustainability Benchmark. We achieved a five-star rating of 91/100, one of the highest first year scores ever, placing in the top 20% of the global benchmark.
We also obtained WELL Health-Safety Certifications from the International WELL Building Institute (IWBI). Dream Office REIT was recognized during the second quarter as Canada’s largest office portfolio to be WELL Health-Safety rated by IWBI with 25 properties totalling 4.6 million square feet or 87% of the Trust’s Canadian gross leasable area being certified by the group.
The WELL Health-Safety Certification is an evidence-based third-party verified rating for all new and existing building and space types focusing on operational policies, maintenance protocols, stakeholder engagement and emergency plans to address a post-COVID-19 environment now and into the future. The certification is designed to empower owners and operators to take the necessary steps in order to prioritize the health and safety of their staff, visitors and other stakeholders. We believe this certification will demonstrate that our buildings are managed with a view towards the safety of our tenants and visitors. These initiatives form a component of the corporate and management goals of the Trust for 2021.
-
Collaboration with ArtworxTO: We have unveiled a large-scale, seven-storey, 3000 square foot portrait photograph called Untitled by emerging artist Jorian Charlton on 330 Bay Street in the heart of Toronto’s Financial District. The piece will inspire and spark wonder in the city as part of ArtworxTO: Toronto’s Year of Public Art 2021-2022, through the initiative Project Reframed, which aims to highlight and empower local emerging BIPOC artists.
See Figure 2, Untitled by Jorian Charlton
BUSINESS UPDATE
As at September 30, 2021, the Trust had approximately $118 million of available liquidity(3), $393 million of unencumbered assets(3) and a level of debt (net total debt-to-net total assets)(3) of 40.7%.
Since March 2020, the COVID-19 pandemic has continued to cause significant economic and social disruptions to Canadian residents and businesses. Until June 11, 2021, the province of Ontario was under an emergency shutdown under the Emergency Management and Civil Protection Act. We are currently undergoing various stages of reopening, but we still do not know the duration and extent of the pandemic, whether there will be additional shutdowns, the effect of variants, or the impact these factors may have on the financial performance of the Trust for the next two years and beyond. Since we announced the launch of our strategic plan in 2016, we have transformed Dream Office REIT into a safer, higher quality company. As a result of these initiatives, we believe Dream Office REIT is currently well positioned, with a portfolio of exceptional real estate, primarily located in downtown Toronto, combined with a strong balance sheet and ample liquidity.
Despite COVID-19’s disruption to the leasing market and our tenants’ abilities to make decisions for their businesses, the Trust is continuing to manage an active pipeline of renewals and new leases with existing and prospective tenants. During Q3 2021 touring activity returned to pre-COVID levels. Towards the end of the quarter we also began to see increased building traffic and parking lot utilization indicating tenants are returning to the office. We believe that these are favourable indicators for future leasing activity.
During the third quarter of 2021, the Trust executed leases totalling approximately 145,000 square feet across our portfolio. In Toronto downtown 106,000 square feet of leases were executed at a weighted average net rent of $33.93 per square foot, or 34.1% higher than the weighted average prior net rent per square foot on the same space, with a weighted average lease term of 9.3 years. In Other markets, we executed leases totalling 39,000 square feet at a weighted average net rent of $12.97 per square foot, a decrease of 19.1% from the weighted average prior net rent on the same space, with a weighted average lease term of 2.8 years. Since the beginning of the year, we have executed leases in Toronto downtown totalling approximately 184,000 square feet at a weighted average net rent of approximately $33.48 per square foot, 27.3% higher than the weighted average prior net rent on the same space, with a weighted average lease term of 7.0 years. In the Other markets region, the Trust has secured leases for approximately 197,000 square feet at a weighted average net rent of $14.14 per square foot, a decrease of 13.5% relative to prior rents primarily due to new deals rolling down to market rates in western Canada, with a weighted average lease term of 4.9 years. To date, the Trust has secured commitments for approximately 912,000 square feet, or 100%, of 2021 full-year portfolio lease expiries. In addition, the Trust has conditional deals in Toronto downtown for approximately 53,000 square feet, or 1.5% of the region’s gross leasable area, of currently vacant space.
Approximately 2.0% of the Trust’s total portfolio is currently sublet, a decrease of 0.2% from the prior quarter, with a weighted average in-place net rent of just over $25 per square foot. This is the lowest level of sublet space in our portfolio since the beginning of the COVID-19 pandemic.
The following table summarizes selected operational statistics with respect to the trailing four quarters and the month of October 2021 as at November 4, 2021, all presented as a percentage of recurring contractual gross rent:
|
Cash |
|
Deferral |
|
|
|
|
collected |
|
arrangements* |
|
Outstanding |
|
Q4 2020 |
98.6% |
—% |
1.4% |
|||
Q1 2021 |
98.6% |
—% |
1.4% |
|||
Q2 2021 |
98.1% |
0.5% |
1.4% |
|||
Q3 2021 |
97.5% |
0.4% |
2.1% |
|||
October 2021 |
97.6% |
—% |
2.4% |
|||
* Deferral arrangements are presented net of subsequently received cash receipts. |
||||||
Our tenant relations team continues to engage with and support our tenants through the pandemic so that they can recover quickly with an economically viable business for the long term. We have been educating tenants on government-led relief initiatives and assisting tenants with back-to-work planning for their employees. In certain instances, the Trust has granted deferrals and rent repayment arrangements to select tenants on a case-by-case basis.
For the three months ended September 30, 2021, the Trust recorded COVID-related provisions totalling approximately $0.4 million which are included in the line item “Government assistance, net of COVID-related provisions” within net rental income. These provision balances represent an estimate of potential credit losses on our trade receivables for all uncollected rent during the three months ended September 30, 2021. Partially offsetting the impact of provisions included in “Government assistance, net of COVID-related provisions” is the impact of government programs totalling $0.2 million that the Trust qualified for during the quarter.
CAPITAL HIGHLIGHTS
KEY FINANCIAL PERFORMANCE METRICS |
|
|
|
|
As at |
|
(unaudited) |
|
September 30, |
|
|
December 31, |
|
|
|
2021 |
|
|
2020 |
|
Financing |
|
|
|
|
||
Weighted average face rate of interest on debt (period-end)(5) |
|
3.33% |
|
3.56% |
||
Interest coverage ratio (times)(3) |
|
3.0 |
|
3.2 |
||
Net total debt-to-adjusted EBITDAFV (years)(3) |
|
9.4 |
|
8.8 |
||
Level of debt (net total debt-to-net total assets)(3) |
|
40.7% |
|
41.1% |
||
Average term to maturity on debt (years) |
|
3.5 |
|
4.1 |
||
Available liquidity and unencumbered assets |
|
|
|
|
||
Available liquidity (in millions)(3) |
$ |
118.3 |
$ |
148.5 |
||
Unencumbered assets (in millions)(3) |
|
393.3 |
|
244.8 |
||
Capital |
|
|
|
|
||
Total number of units (in millions)(6) |
|
54.9 |
|
55.9 |
||
Net asset value (“NAV”) per unit(3) |
$ |
30.74 |
$ |
28.69 |
||
See footnotes at end. |
-
Financing update: On July 2, 2021, the Trust refinanced a mortgage secured by an investment property in Calgary at maturity totalling $14.5 million for a term of five years at an annual fixed interest rate of 2.54%.
Also on July 2, 2021 the Trust refinanced a mortgage secured by an investment property in Calgary prior to maturity, without penalty, totalling $10.0 million for a term of five years at an annual fixed interest rate of 3.15%.
The Trust has addressed all of its 2021 mortgage maturities.
On November 4, 2021, subsequent to the quarter, the Trust increased its existing revolving credit facility from $300 million to $375 million and extended the maturity date from March 1, 2022 to September 30, 2024. The interest rate remained in the form of rolling bankers’ acceptances (“BA”) bearing interest at the BA rate plus 170 bps or at the bank’s prime rate plus 70 bps. The Trust continues to have an accordion option of up to $100 million of additional borrowing capacity subject to lender approval. The $75 million increase in availability is dependent on the pledging of one additional investment property and 4,200,108 additional Dream Industrial LP Class B limited partnership units.
- NAV per unit(3): As at September 30, 2021, our NAV per unit increased to $30.74 when compared to $28.69 at December 31, 2020. The increase in NAV per unit relative to December 31, 2020, was primarily due to cash flow retention (diluted FFO net of distributions), fair value gains on investment properties at Eglinton and Birchmount in Scarborough, Ontario and, to a lesser extent, our completed development at 1900 Sherwood Place in Regina, Saskatchewan, and incremental income from our investment in Dream Industrial REIT.
“Our balance sheet remains solid with ample liquidity to execute on our investment and capital program,” said Jay Jiang, Chief Financial Officer of Dream Office REIT. “We had a successful year in financing by securing over $500 million of debt and financing commitments at a weighted average interest rate of 2.28% including the extension and upsizing of our revolving credit facility post quarter. We will have very minimal refinancing risk in 2022 with only $60 million of mortgage expiries.”
CONFERENCE CALL
Dream Office REIT holds semi-annual conference calls following the release of second and fourth quarter results.
OTHER INFORMATION
Information appearing in this press release is a selected summary of results. The condensed consolidated financial statements and Management’s Discussion and Analysis (“MD&A”) of the Trust are available at www.dreamofficereit.ca and on www.sedar.com.
Dream Office REIT is an unincorporated, open-ended real estate investment trust. Dream Office REIT is a premier office landlord in downtown Toronto with approximately 3.5 million square feet owned and managed. We have carefully curated an investment portfolio of high-quality assets in irreplaceable locations in one of the finest office markets in the world. We intend to enhance these properties to elevate their desirability to tenants and investors and improve the overall community experience. For more information, please visit our website at www.dreamofficereit.ca.
| FOOTNOTES | ||
(1) |
Excludes joint ventures that are equity accounted at the end of each period. |
|
(2) |
Excludes properties under development and joint ventures that are equity accounted at the end of each period. |
|
(3) |
FFO, comparative properties NOI, diluted FFO per unit, NAV per unit, interest coverage ratio, net total debt-to-adjusted EBITDAFV, level of debt (net total debt-to-net total assets), available liquidity and unencumbered assets are non-GAAP measures used by management in evaluating operating and financial performance. Please refer to the cautionary statements under the heading “Non-GAAP Measures” in this press release. |
|
(4) |
A description of the determination of diluted amounts per unit can be found in section "Our Equity" under the heading “Weighted average number of units” of the MD&A for the three and nine months ended September 30, 2021. |
|
(5) |
Weighted average face rate of interest on debt is calculated as the weighted average face rate of all interest bearing debt balances excluding debt in joint ventures that are equity accounted. |
|
(6) |
Total number of units includes 5.2 million LP B Units which are classified as a liability under IFRS. |
|
NON-GAAP MEASURES
The Trust’s condensed consolidated financial statements are prepared in accordance with International Financial Reporting Standards (“IFRS”). In this press release, as a complement to results provided in accordance with IFRS, the Trust discloses and discusses certain non-GAAP financial measures, including FFO, comparative properties NOI, diluted FFO per unit, available liquidity, level of debt (net total debt-to-net total assets), unencumbered assets, interest coverage ratio, net total debt-to-adjusted EBITDAFV and NAV per unit, as well as other measures discussed elsewhere in this release. These non-GAAP measures are not defined by IFRS, do not have a standardized meaning and may not be comparable with similar measures presented by other income trusts. The Trust has presented such non-GAAP measures as Management believes they are relevant measures of the Trust’s underlying operating performance and debt management. Non-GAAP measures should not be considered as alternatives to net income, net rental income, cash flows generated from (utilized in) operating activities, cash and cash equivalents, total assets, non-current debt, total equity, or comparable metrics determined in accordance with IFRS as indicators of the Trust’s performance, liquidity, leverage, cash flow, and profitability. For a full description of these measures and, where applicable, a reconciliation to the most directly comparable measure calculated in accordance with IFRS, please refer to the “Non-GAAP Measures” section in Dream Office REIT’s MD&A for the three and nine months ended September 30, 2021.
FORWARD-LOOKING INFORMATION
This press release may contain forward-looking information within the meaning of applicable securities legislation, including statements regarding our objectives and strategies to achieve those objectives, our expectations regarding parking revenues and comparative properties NOI after the COVID-19 pandemic, the future structure of our Alate investment, our ability to increase the desirability of our buildings, our asset management strategies and prospective leasing activity. Forward-looking information is based on a number of assumptions and is subject to a number of risks and uncertainties, many of which are beyond Dream Office REIT’s control, which could cause actual results to differ materially from those that are disclosed in or implied by such forward-looking information. These risks and uncertainties include, but are not limited to, general and local economic and business conditions; employment levels; mortgage and interest rates and regulations; the uncertainties around the timing and amount of future financings; uncertainties surrounding the COVID-19 pandemic; the effect of government restrictions on leasing and building traffic; the ability of the Trust and its tenants to access government programs; the financial condition of tenants; the timing of current and prospective tenants’ return to the office and its effect on leasing activity, building traffic and comparative properties NOI, our ability to refinance maturing debt; leasing risks, including those associated with the ability to lease vacant space; rental rates on future leasing; future parking revenues and interest and currency rate fluctuations. Our objectives and forward-looking statements are based on certain assumptions, including that the general economy remains stable, interest rates remain stable, conditions within the real estate market remain consistent, competition for acquisitions remains consistent with the current climate and that the capital markets continue to provide ready access to equity and/or debt. All forward-looking information in this press release speaks as of the date of this press release. Dream Office REIT does not undertake to update any such forward-looking information whether as a result of new information, future events or otherwise except as required by law. Additional information about these assumptions and risks and uncertainties is contained in Dream Office REIT’s filings with securities regulators, including its latest annual information form and MD&A. These filings are also available at Dream Office REIT’s website at www.dreamofficereit.ca.
View source version on businesswire.com: https://www.businesswire.com/news/home/20211104006374/en/
Michael J. Cooper
Chairman and Chief Executive Officer
(416) 365-5145
[email protected]
Jay Jiang
Chief Financial Officer
(416) 365-6638
[email protected]
Please make the indicated changes including the new text: US quotes snapshot data provided by IEX. Additional price data and company information powered by Twelve Data.