
Dream Office REIT Reports Q3 2020 Results
DREAM OFFICE REAL ESTATE INVESTMENT TRUST (D.UN-TSX) or (“Dream Office REIT”, the “Trust” or “we”) today announced its financial results for the three and nine months ended September 30, 2020 and provided a business update related to the COVID-19 pandemic.
This press release features multimedia. View the full release here: https://www.businesswire.com/news/home/20201105006233/en/
(Photo: Business Wire)
FINANCIAL HIGHLIGHTS
SELECTED FINANCIAL INFORMATION |
|
Three months ended |
|
|
Nine months ended |
|||||||||
| (unaudited) |
|
September 30, |
|
June 30, |
September 30, |
|
|
September 30, |
|
|
September 30, |
|||
| (In thousands of dollars except per unit amounts) |
|
2020 |
|
2020 |
|
2019 |
|
|
2020 |
|
|
2019 |
||
Operating results |
|
|
|
|
|
|
|
|
|
|
|
|
|
|
Net income (loss) |
$ |
39,294 |
|
$ |
57,600 |
|
$ (2,340) |
|
$ |
161,725 |
|
|
$ |
54,127 |
Funds from operations (“FFO”)(1) |
|
23,088 |
|
|
23,136 |
|
26,678 |
|
|
70,306 |
|
|
|
83,699 |
Net rental income |
|
27,890 |
|
|
28,179 |
|
31,962 |
|
|
84,997 |
|
|
|
96,492 |
Comparative properties net operating |
||||||||||||||
income ("NOI")(1) |
|
30,150 |
|
|
30,128 |
|
30,605 |
|
|
91,472 |
|
|
|
91,524 |
Per unit amounts |
|
|
|
|
|
|
|
|
|
|
|
|
|
|
FFO (diluted)(1)(2) |
$ |
0.38 |
|
$ |
0.38 |
|
$ 0.42 |
|
$ |
1.14 |
|
|
$ |
1.30 |
Distribution rate |
|
0.25 |
|
|
0.25 |
|
0.25 |
|
|
0.75 |
|
|
|
0.75 |
Net asset value (“NAV”)(1) |
|
28.17 |
|
|
27.61 |
|
25.79 |
|
|
28.17 |
|
|
|
25.79 |
See footnotes at end. |
||||||||||||||
UNITS AND PORTFOLIO INFORMATION |
|
As at |
||||||
(unaudited) |
|
September 30, |
|
|
June 30, |
|
|
September 30, |
|
|
2020 |
|
|
2020 |
|
|
2019 |
Units |
|
|
|
|
|
|
||
Total number of units (in millions)(3) |
|
58.0 |
|
60.5 |
|
61.5 |
||
Total portfolio information(4) |
|
|
|
|
|
|
||
Number of active properties |
|
28 |
|
29 |
|
31 |
||
Number of properties under development |
|
2 |
|
2 |
|
2 |
||
Gross leasable area (“GLA”) (in millions of sq. ft.) |
|
5.5 |
|
5.5 |
|
6.1 |
||
Investment properties value (in billions) |
$ |
2.5 |
$ |
2.5 |
$ |
2.5 |
||
See footnotes at end. |
||||||||
- Net income for the quarter and year-to-date: For the three and nine months ended September 30, 2020, the Trust generated net income of $39.3 million and $161.7 million, respectively. Included in net income are net rental income totalling $27.9 million and $85.0 million, respectively, and fair value gains recorded on financial instruments totalling $14.1 million and $76.1 million, respectively, primarily attributed to the revaluation of the subsidiary redeemable units.
-
Diluted FFO per unit(1)(2) for the quarter and year-to-date: Diluted FFO per unit for the three months ended September 30, 2020 was $0.38, compared to $0.38 at Q2 2020 and $0.42 at Q3 2019. Diluted FFO per unit for the nine months ended September 30, 2020 was $1.14 compared to $1.30 in the prior year comparative period.
The year-over-year decrease in diluted FFO per unit for the three months ended September 30, 2020 was mainly due to asset sales (net of unit buybacks and debt reduction) (-$0.02), and lower comparative properties NOI and the net impact of COVID-related provisions and adjustments on our results (-$0.02).
The year-over-year decrease in diluted FFO per unit for the nine months ended September 30, 2020 was mainly due to asset sales (net of unit buybacks and debt reduction) (-$0.10), lower comparative properties NOI and the net impact of COVID-related provisions and adjustments on our results (-$0.02), lower share of FFO from our investment in Dream Industrial REIT (-$0.03) and other items (-$0.01).
Diluted FFO per unit was flat when compared to the prior quarter as general and administrative and interest expense savings (+$0.01) were offset by other items (-$0.01).
- Net rental income for the quarter and year-to-date: For the three and nine months ended September 30, 2020, the Trust generated net rental income of $27.9 million and $85.0 million, respectively, compared to $32.0 million and $96.5 million, respectively, for the three and nine months ended September 30, 2019. Net rental income for the three and nine months ended September 30, 2020 decreased relative to the prior year comparative periods primarily due to lower transient parking revenues as a result of parking lot closures from city lockdown restrictions across our portfolio, COVID-related provisions net of the effect of government programs and asset sales during the prior year.
-
Comparative properties NOI(1) for the quarter and year-to-date: For the three months ended September 30, 2020, comparative properties NOI remained relatively stable at $30.2 million, when compared with the prior quarter, predominately driven by higher in-place net rents in Toronto downtown, offset by lower transient parking revenues in both regions as previously mentioned as well as lower weighted average occupancy and in-place net rents in the Other markets region.
For the three months ended September 30, 2020, comparative properties NOI decreased by 1.5%, or $0.5 million, over the prior year comparative quarter, primarily driven by lower transient parking revenues in both of our regions as a result of city lockdown restrictions and lower weighted average occupancy. We expect parking revenues to improve when lockdown restrictions are lifted and traffic to our properties improves. Partially offsetting the declines were higher in-place net rents in Toronto downtown.
For the nine months ended September 30, 2020, comparative properties NOI was relatively flat when compared with the prior year comparative period. Lower parking revenues across the portfolio and lower occupancy in the Other markets region were offset by higher rental rates in Toronto downtown on leases that commenced during the period. At a regional level, comparative properties NOI for the nine months ended September 30, 2020 increased by $0.4 million, or 0.6%, in Toronto downtown and decreased by $0.5 million, or 2.4%, in Other markets. Excluding the effect of lost revenue from parking lot closures, overall comparative properties NOI for the nine months ended September 30, 2020 for the Toronto downtown and Other markets regions would have increased by $1.6 million, or 2.3%, and $0.1 million, or 0.5%, respectively, over the prior year comparative period.
We are actively managing our assets in the Toronto downtown region, which represent 86% of our comparative investment property fair values, to improve the quality of the buildings and to continue to improve rental rates in this market. For our assets in the Other markets region, which make up the remaining 14% of the fair value of our comparative investment properties, we are repositioning these assets to improve occupancy and liquidity in the private market.
-
NAV per unit(1): As at September 30, 2020, our NAV per unit was $28.17, compared to $27.61 at June 30, 2020 and $25.79 at September 30, 2019, up $0.56 or 2.0% and $2.38 or 9.2%, respectively.
The quarter-over-quarter and year-over-year increase in NAV per unit of $0.56 and $2.38, respectively, was primarily due to cash flow retention from operations (diluted FFO net of distributions) and our incremental share of income from our investment in Dream Industrial REIT. The year-over-year increase in NAV per unit was also driven by fair value uplifts in our Toronto downtown investment properties totalling $97.6 million, which comprise fair value gains of $62.6 million in 2020, supported by third party appraisals on six investment properties in the region and $35.0 million in Q4 2019 as a result of higher market rent assumptions.
NAV per unit is considered one of the Trust’s key metrics and has increased consistently over the past 14 quarters as we improve the quality of our assets and the value of the business.
-
Disposition subsequent to quarter: On October 16, 2020, the Trust completed the sale of an investment property located in Saskatoon for total gross proceeds (before adjustments and transaction costs) of $12.8 million. The net proceeds were used to repurchase REIT A Units for cancellation through our NCIB program.
BUSINESS UPDATE
As at September 30, 2020, the Trust had approximately $153 million of available liquidity(1), $293 million of unencumbered assets(1) and a level of debt (net total debt-to-net total assets)(1) of 39.9%. During the third quarter a $14.5 million mortgage secured by a property in downtown Toronto matured and was fully repaid. We have received a commitment from a lender for $44 million for an interest-only mortgage to be secured by the same property for a seven-year term at an indicative interest rate of approximately 3% based on current prevailing market interest rates.
Since March 2020, the COVID-19 pandemic continues to cause significant economic and social disruptions to Canadian residents and businesses. At this time, we still do not know the duration and extent of the pandemic or the impact it may have on the financial performance of the Trust for the next two years and beyond. Since we announced the launch of our strategic plan in 2016, we have transformed Dream Office REIT into a safer, higher quality company. As a result of these initiatives, we believe Dream Office REIT is currently well positioned, with a portfolio of exceptional real estate, primarily located in downtown Toronto, combined with a strong balance sheet and ample liquidity.
Despite COVID-19’s disruption to the leasing market and physical distancing measures currently in place, the Trust is managing an active pipeline of renewals and new leases with existing and prospective tenants. To date, the Trust has secured commitments for approximately 77% or 0.4 million square feet of total full year 2020 portfolio expiries. Approximately 2.3% of the Trust’s portfolio with a weighted average in-place net rent of $25.71 per square foot is currently sublet. This ratio is relatively in-line with the Trust’s historical percentages.
To date, the Trust has executed leases totalling approximately 430,000 square feet across our portfolio at a weighted average net rent of approximately $33.62 per square foot, or 37% higher than the weighted average expiring net rent on the same space. Of that total, approximately 400,000 square feet were leased during the COVID-19 period from April 1, 2020 to date.
The following table summarizes selected operational statistics with respect to the period from April to October 2020, all presented as a percentage of recurring contractual gross rent by month as at November 5, 2020:
SELECTED OPERATIONAL STATISTICS |
|
|
25% of rent
|
|
|||||
(unaudited) |
Cash
|
Deferral
|
under
|
Outstanding |
|||||
April 2020 |
96.8 |
% |
0.5 |
% |
1.3 |
% |
1.4 |
% |
|
May 2020 |
95.5 |
% |
1.4 |
% |
1.3 |
% |
1.8 |
% |
|
June 2020 |
93.9 |
% |
2.9 |
% |
1.3 |
% |
1.9 |
% |
|
Q2 2020 |
95.4 |
% |
1.6 |
% |
1.3 |
% |
1.7 |
% |
|
July 2020 |
94.8 |
% |
2.1 |
% |
1.3 |
% |
1.8 |
% |
|
August 2020 |
96.7 |
% |
0.5 |
% |
1.3 |
% |
1.5 |
% |
|
September 2020 |
96.4 |
% |
0.1 |
% |
1.3 |
% |
2.2 |
% |
|
Q3 2020 |
96.0 |
% |
0.9 |
% |
1.3 |
% |
1.8 |
% |
|
October 2020 |
94.0 |
% |
0.1 |
% |
n/a |
5.9 |
% |
||
* Includes the 50% of recurring contractual gross rent that the Trust received from the government through the CECRA program.
|
|||||||||
On August 6, 2020, the date of the Trust’s second quarter results, the cash collected for Q2 2020 rents was 91.0%. As of November 5, 2020, the cash collected has improved to 95.4% and the Trust expects to collect the majority of the outstanding deferral arrangements.
Our tenant relations team continues to engage and support our tenants through the pandemic so that they can recover quickly with an economically viable business for the long term. We have been educating tenants on government-led relief initiatives and assisting tenants with back to work planning for their employees. In certain instances, the Trust has granted deferrals and rent repayment arrangements to select tenants on a case-by-case basis.
From April to September of 2020, we worked with our tenants to apply for the Canada Emergency Commercial Rent Assistance (“CECRA”) program operated jointly by the federal and provincial governments. Under the program, tenants paid 25% of their April to September gross rents, while the Trust forgave 25% and the government reimbursed us for the remaining 50%. Through participation in the CECRA program we were able to help approximately 100 tenants to meet their rental obligations during this difficult time. The Trust has collected substantially all of the 25% rent that the participating tenants owe to the Trust.
On October 9, 2020, the federal government announced the new Canada Emergency Rent Subsidy (“CERS”) program that replaces the CECRA program which ended on September 30, 2020. Under the new program, eligible tenants would have their rent subsidized based on a sliding scale of up to 65%, with an additional 25% for businesses which were required to shut down as a result of a mandatory public health order. We are collaboratively working with a significant portion of our tenants with rent outstanding for the month of October, and are awaiting further details of the CERS program, which have yet to be announced by the federal government. We believe that the CERS program will be effective in assisting our tenants in meeting their ongoing rental obligations.
We have also agreed to work with certain tenants representing approximately 0.9% of the third quarter’s recurring contractual gross rent by deferring their gross rent for a period of time to help their businesses. The current weighted average deferral period on current arrangements is approximately six months.
During the three months ended September 30, 2020, the Trust has recorded COVID-related provisions totalling approximately $1.2 million which are included in the line item “COVID-related provisions and adjustments” within net rental income. This provisions balance represents an estimate of potential credit losses on our trade receivables for all uncollected rent during the three months ended September 30, 2020 along with the 25% of recurring contractual gross rent that the Trust forgave under the CECRA program for eligible tenants. Partially offsetting the impact of provisions included in “COVID-related provisions and adjustments” is the impact of government subsidy programs totalling $0.6 million that the Trust qualified for during the third quarter.
“The prolonged COVID-19 pandemic has been a significant shock to our economic and social system and the adjustments to our day-to-day lives and how we work have been massive,” said Michael J. Cooper, Chief Executive Officer of Dream Office REIT. “Despite these uncertainties, the changes that we have made to Dream Office REIT over the past five years have positioned the business well for these challenges. Our buildings are in excellent shape, well located, well leased and we will continue to make improvements to increase the desirability of the buildings to our tenants and investors.”
CAPITAL HIGHLIGHTS
KEY FINANCIAL PERFORMANCE METRICS |
|
|
|
|
|
|
As at |
||||||||
(unaudited) |
September 30, |
|
June 30, |
|
December 31, |
|
September 30, |
||||||||
|
2020 |
|
2020 |
|
2019 |
|
2019 |
||||||||
Financing |
|
|
|
|
|
|
|
||||||||
Weighted average face rate of interest on debt (period-end)(5) |
3.60 |
% |
|
3.68 |
% |
|
3.88 |
% |
|
3.88 |
% |
||||
Interest coverage ratio (times)(1)(6) |
3.2 |
|
3.1 |
|
2.9 |
|
2.9 |
||||||||
Net total debt-to-adjusted EBITDAFV (years)(1)(6) |
8.4 |
|
8.1 |
|
7.5 |
|
8.0 |
||||||||
Level of debt (net total debt-to-net total assets)(1) |
39.9 |
% |
|
38.3 |
% |
|
37.6 |
% |
|
41.3 |
% |
||||
Average term to maturity on debt (years) |
4.3 |
|
4.6 |
|
4.7 |
|
4.9 |
||||||||
Available liquidity and unencumbered assets |
|
|
|
|
|
|
|
||||||||
Available liquidity (in millions)(1) |
$ |
152.5 |
|
$ |
213.9 |
|
$ |
413.6 |
|
$ |
433.8 |
||||
Unencumbered assets (in millions)(1) |
292.7 |
|
239.7 |
|
281.3 |
|
156.4 |
||||||||
See footnotes at end. |
|||||||||||||||
- REIT A Units purchased for cancellation: To date, the Trust has purchased for cancellation 5.2 million REIT A Units under the normal course issuer bid (“NCIB”) program, at a cost of approximately $97.8 million or $18.91 per unit. We believe that the market price of our REIT A Units since March 2020 has not reflected the intrinsic value of the Trust and the repurchase of REIT A Units represented an attractive investment opportunity. Accordingly, the Trust has been purchasing REIT A Units for cancellation and is prepared to continue to purchase REIT A Units through its NCIB program as market conditions warrant.
“The pandemic has created a very difficult operating environment for commercial landlords and tenants,” said Jay Jiang, Chief Financial Officer of Dream Office REIT. “Despite these challenges, we believe the Trust’s financial results over the past two quarters have remained stable and confirms the quality of our portfolio, tenant base and the strategies we have adopted. We look forward to continuing to work with our tenants, lenders and partners on the road to recovery.”
OPERATIONAL HIGHLIGHTS
SELECTED OPERATIONAL INFORMATION |
As at |
||||||||||
(unaudited) |
September 30, |
|
June 30, |
|
September 30, |
||||||
|
2020 |
|
2020 |
|
2019 |
||||||
Comparative portfolio(7) |
|
|
|
|
|
||||||
Occupancy rate - including committed (period-end) |
88.0 |
% |
|
88.4 |
% |
|
90.0 |
% |
|||
Occupancy rate - in-place (period-end) |
87.7 |
% |
|
87.9 |
% |
|
89.5 |
% |
|||
Average in-place and committed net rent per square foot (period-end) |
$ |
23.09 |
|
$ |
23.01 |
|
$ |
22.53 |
|||
Weighted average lease term (years) |
5.1 |
|
5.3 |
|
5.2 |
||||||
See footnotes at end. |
|||||||||||
-
In-place occupancy: Comparative portfolio in-place occupancy on a quarter-over-quarter basis was relatively flat when compared to Q2 2020 as natural expiries were substantially addressed through renewals and new leasing.
Comparative portfolio in-place occupancy on a year-over-year basis decreased from 89.5% at Q3 2019 to 87.7% this quarter. In Toronto downtown, in-place occupancy decreased by 60 basis points relative to Q3 2019 due to 22,500 square feet of net negative leasing absorption. In the Other markets region, Saskatchewan saw 33,000 square feet of net negative leasing absorption, and the Greater Toronto Area had 33,000 square feet of net negative leasing absorption, primarily due to a tenant bankruptcy at an industrial space totalling 55,000 square feet that predates COVID-19 during Q2 2020 at our Eglinton and Birchmount property, offset by 22,000 square feet of net positive leasing absorption through the remainder of that geographic area. Net rents on the space occupied by the bankrupt tenant were $4.00 per square foot, which we believe are well below market rates for industrial space in the current market, presenting an opportunity for us to surface additional value. We are currently working with a few prospective tenants on this space.
- Lease commencements for the quarter and year-to-date: For the three and nine months ended September 30, 2020, approximately 70,000 square feet and 177,000 square feet, respectively, of leases commenced, not including temporary leases. Rental rates on renewals and relocations over the respective periods were 11% and 21% above expiring rates, predominately due to positive leasing spreads on renewals in Toronto downtown, partially offset by some negative leasing spreads on renewals in Saskatchewan within Other markets.
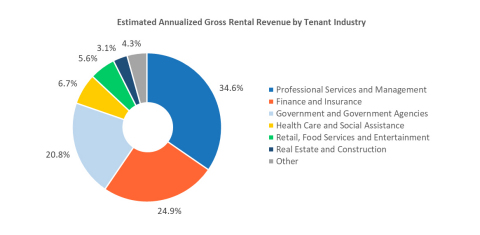
- Tenant profile: As illustrated in the chart below, the Trust has a diversified and healthy tenant mix.
See chart at top of release.
Our top 10 tenants make up more than 35% of gross rental revenue and 50% of our top tenants have credit ratings of A or higher.
CALL
Dream Office REIT holds semi-annual conference calls following the release of second and fourth quarter results.
OTHER INFORMATION
Information appearing in this news release is a selected summary of results. The condensed consolidated financial statements and Management’s Discussion and Analysis (“MD&A”) of the Trust are available at www.dreamofficereit.ca and on www.sedar.com.
Dream Office REIT is an unincorporated, open-ended real estate investment trust. Dream Office REIT owns well-located, high-quality office properties, primarily in downtown Toronto. For more information, please visit our website at www.dreamofficereit.ca.
FOOTNOTES |
||
(1) |
FFO, comparative properties NOI, diluted FFO per unit, NAV per unit, interest coverage ratio, net total debt-to-adjusted EBITDAFV, level of debt (net total debt-to-net total assets), available liquidity and unencumbered assets are non-GAAP measures used by management in evaluating operating and financial performance. Please refer to the cautionary statements under the heading “Non-GAAP Measures” in this press release. |
|
(2) |
A description of the determination of diluted amounts per unit can be found in section "Our Equity" under the heading “Weighted average number of units” of the MD&A for the three and nine months ended September 30, 2020. |
|
(3) |
Total number of units includes 5.2 million LP B Units which are classified as a liability under IFRS. |
|
(4) |
Excludes properties held for sale and joint ventures that are equity accounted at the end of each period, as applicable. |
|
(5) |
Weighted average face rate of interest on debt is calculated as the weighted average face rate of all interest bearing debt balances excluding debt in joint ventures that are equity accounted. |
|
(6) |
Interest coverage ratio and net total debt-to-adjusted EBITDAFV as at September 30, 2019 have been restated to conform to current period presentation due to a change in the calculation of EBITDAFV. For further details, please refer to the “Non-GAAP Measures” section under the heading “Earnings before interest, taxes, depreciation, amortization and fair value adjustments (“EBITDAFV”)” in Dream Office REIT’s MD&A for the three and nine months ended September 30, 2020. |
|
(7) |
Comparative portfolio excludes acquired properties, properties held for sale and sold, properties under development and joint ventures that are equity accounted as at September 30, 2020. Acquired properties and properties under development are excluded from comparative properties until they have been operating for two full calendar years. Acquired properties comprises 6 Adelaide Street East, Toronto downtown which was acquired on September 12, 2019. |
|
NON-GAAP MEASURES
The Trust’s condensed consolidated financial statements are prepared in accordance with International Financial Reporting Standards (“IFRS”). In this press release, as a complement to results provided in accordance with IFRS, the Trust discloses and discusses certain non-GAAP financial measures, including FFO, comparative properties NOI, diluted FFO per unit, NAV per unit, available liquidity, unencumbered assets, level of debt (net total debt-to-net total assets), interest coverage ratio and net total debt-to-adjusted EBITDAFV, as well as other measures discussed elsewhere in this release. These non-GAAP measures are not defined by IFRS, do not have a standardized meaning and may not be comparable with similar measures presented by other income trusts. The Trust has presented such non-GAAP measures as Management believes they are relevant measures of the Trust’s underlying operating performance and debt management. Non-GAAP measures should not be considered as alternatives to net income, net rental income, cash flows generated from (utilized in) operating activities, cash and cash equivalents, total assets, non-current debt, total equity, or comparable metrics determined in accordance with IFRS as indicators of the Trust’s performance, liquidity, cash flow, and profitability. For a full description of these measures and, where applicable, a reconciliation to the most directly comparable measure calculated in accordance with IFRS, please refer to the “Non-GAAP Measures” section in Dream Office REIT’s MD&A for the three and nine months ended September 30, 2020.
FORWARD-LOOKING INFORMATION
This press release may contain forward-looking information within the meaning of applicable securities legislation, including statements regarding our objectives and strategies to achieve those objectives, our expectations regarding parking revenues after the COVID-19 pandemic, our expectations regarding the effectiveness of the CERS program, our ability to increase the desirability of our buildings, our asset management strategies, future purchases of units through its NCIB program and prospective leasing activity. Forward-looking information is based on a number of assumptions and is subject to a number of risks and uncertainties, many of which are beyond Dream Office REIT’s control, which could cause actual results to differ materially from those that are disclosed in or implied by such forward-looking information. These risks and uncertainties include, but are not limited to, general and local economic and business conditions; employment levels; mortgage and interest rates and regulations; the uncertainties around the timing and amount of future financings; uncertainties surrounding the COVID-19 pandemic; the ability of the Trust and its tenants to access government programs; the financial condition of tenants; our ability to refinance maturing debt; leasing risks, including those associated with the ability to lease vacant space; rental rates on future leasing; future parking revenues and interest and currency rate fluctuations. Our objectives and forward-looking statements are based on certain assumptions, including that the general economy remains stable, interest rates remain stable, conditions within the real estate market remain consistent, competition for acquisitions remains consistent with the current climate and that the capital markets continue to provide ready access to equity and/or debt. All forward-looking information in this press release speaks as of the date of this press release. Dream Office REIT does not undertake to update any such forward-looking information whether as a result of new information, future events or otherwise except as required by law. Additional information about these assumptions and risks and uncertainties is contained in Dream Office REIT’s filings with securities regulators, including its latest annual information form and MD&A. These filings are also available at Dream Office REIT’s website at www.dreamofficereit.ca.
View source version on businesswire.com: https://www.businesswire.com/news/home/20201105006233/en/
Michael J. Cooper
Chairman and Chief Executive Officer
(416) 365-5145
[email protected]
Jay Jiang
Chief Financial Officer
(416) 365-6638
[email protected]
Please make the indicated changes including the new text: US quotes snapshot data provided by IEX. Additional price data and company information powered by Twelve Data.