
Dream Office REIT Reports Q2 2020 Results
DREAM OFFICE REAL ESTATE INVESTMENT TRUST (D.UN-TSX) or (“Dream Office REIT”, the “Trust” or “we”) today announced its financial results for the three and six months ended June 30, 2020 and provided a business update related to the COVID-19 pandemic. Management will host a conference call to discuss the financial results on August 7, 2020 at 10:00 a.m. (ET).
This press release features multimedia. View the full release here: https://www.businesswire.com/news/home/20200806006087/en/
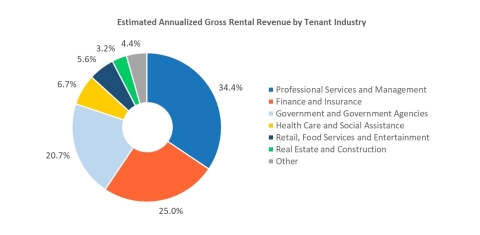
Figure 1, Estimated Annualized Gross Rental Revenue by Tenant Industry (Photo: Business Wire)
FINANCIAL HIGHLIGHTS
SELECTED FINANCIAL INFORMATION |
|
Three months ended |
|
|
|
Six months ended |
|
||||||||||||
(unaudited) |
|
June 30,
|
|
|
|
March 31,
|
|
|
|
June 30,
|
|
|
|
June 30,
|
|
|
|
June 30,
|
|
(In thousands of dollars except per unit amounts) |
|
|
|
|
|
|
|
|
|
|
|
|
|
|
|||||
Operating results |
|
|
|
|
|
|
|
|
|
|
|
|
|
|
|||||
Net income |
$ |
57,600 |
|
|
$ |
64,831 |
|
|
$ |
46,533 |
|
|
$ |
122,431 |
|
|
$ |
56,467 |
|
Funds from operations (“FFO”)(1) |
|
23,136 |
|
|
|
24,082 |
|
|
|
28,721 |
|
|
|
47,218 |
|
|
|
57,021 |
|
Net rental income |
|
28,179 |
|
|
|
28,928 |
|
|
|
32,348 |
|
|
|
57,107 |
|
|
|
64,530 |
|
Comparative properties net operating income ("NOI")(1) |
|
30,401 |
|
|
|
31,502 |
|
|
|
31,502 |
|
|
|
61,903 |
|
|
|
61,668 |
|
Per unit amounts |
|
|
|
|
|
|
|
|
|
|
|
|
|
|
|||||
FFO (diluted)(1)(2) |
$ |
0.38 |
|
|
$ |
0.39 |
|
|
$ |
0.44 |
|
|
$ |
0.76 |
|
|
$ |
0.88 |
|
Distribution rate |
|
0.25 |
|
|
|
0.25 |
|
|
|
0.25 |
|
|
|
0.50 |
|
|
|
0.50 |
|
Net asset value (“NAV”)(1) |
|
27.61 |
|
|
|
27.13 |
|
|
|
25.49 |
|
|
|
27.61 |
|
|
|
25.49 |
|
See footnotes at end.
UNITS AND PORTFOLIO INFORMATION |
|
As at |
|
||||||
(unaudited) |
|
June 30, |
|
|
March 31, |
|
|
June 30, |
|
|
|
2020 |
|
|
2020 |
|
|
2019 |
|
Units |
|
|
|
|
|
|
|||
Total number of units (in millions)(3) |
|
60.5 |
|
|
60.8 |
|
|
63.6 |
|
Total portfolio information(4) |
|
|
|
|
|
|
|||
Number of active properties |
|
29 |
|
|
29 |
|
|
31 |
|
Number of properties under development |
|
2 |
|
|
2 |
|
|
2 |
|
Gross leasable area (“GLA”) (in millions of sq. ft.) |
|
5.5 |
|
|
5.5 |
|
|
6.2 |
|
Investment properties value (in billions) |
$ |
2.5 |
|
$ |
2.4 |
|
$ |
2.5 |
|
See footnotes at end.
- Net income for the quarter and year-to-date: For the three and six months ended June 30, 2020, the Trust generated net income of $57.6 million and $122.4 million, respectively. Included in net income are fair value gains recorded on financial instruments totalling $16.7 million and $62.0 million, respectively, primarily attributed to the revaluation of the subsidiary redeemable units and fair value gains recorded on investment properties totalling $20.2 million and $24.9 million, respectively.
-
Diluted FFO per unit(1)(2) for the quarter and year-to-date: Diluted FFO per unit for the three months ended June 30, 2020 was $0.38, compared to $0.39 at Q1 2020 and $0.44 at Q2 2019. Diluted FFO per unit for the six months ended June 30, 2020 was $0.76 compared to $0.88 in the prior year comparative period.
The year-over-year decrease in diluted FFO per unit for the three and six months ended June 30, 2020 was mainly due to asset sales (net of unit buybacks and debt reduction) (-$0.03 and -$0.08, respectively), lower comparative properties NOI(1) and the net impact of COVID-related provisions and adjustments on our results (-$0.02 and -$nil, respectively), lower share of FFO from our investment in Dream Industrial REIT (-$0.01 and -$0.02, respectively) and other items ($nil and -$0.02, respectively).
The quarter-over-quarter decrease in diluted FFO per unit for the three months ended June 30, 2020 was primarily driven by lower comparative properties NOI(1) and including the net impact of COVID-related provisions and adjustments on our results (-$0.02), partially offset by lower units outstanding as a result of unit repurchases under the Normal Course Issuer Bid (“NCIB”) (+$0.01).
- Net rental income for the quarter and year-to-date: For the three and six months ended June 30, 2020, the Trust generated net rental income of $28.2 million and $57.1 million, respectively, compared to $32.3 million and $64.5 million, respectively, for the three and six months ended June 30, 2019. Net rental income for the quarter decreased relative to the prior year comparative quarter primarily due to lower transient parking revenues as a result of parking lot closures from city lockdown restrictions across our portfolio, COVID-related provisions net of the effect of government programs and asset sales during the prior year.
-
Comparative properties NOI(1) for the quarter and year-to-date: For the three months ended June 30, 2020, comparative properties NOI decreased by 3.5%, or $1.1 million, over the prior year comparative quarter, primarily driven by lower transient parking revenues in both of our regions as previously mentioned and lower weighted average occupancy and in-place net rents in Other markets.
For the six months ended June 30, 2020, comparative properties NOI increased by 0.4%, or $0.2 million, over the prior year comparative period, mainly driven by higher rental rates in Toronto downtown, partially offset by the same reasons noted above. We expect parking revenues to recover over time as city lockdown restrictions across our portfolio are lifted and traffic to our properties improves. In the meantime, we have offered these available parking spaces in Toronto downtown to hospital workers and first responders to help combat the pandemic.
We are actively managing our assets in the Toronto downtown region, which represent 85% of our comparative investment property fair values, to improve the quality of the buildings and to continue to improve rental rates in this market. For our assets in the Other markets region, which make up the remaining 15% of the fair value of our comparative investment properties, we are repositioning these assets to improve occupancy and liquidity in the private market.
For the three months ended June 30, 2020, comparative properties NOI decreased by 3.5%, or $1.1 million, when compared with Q1 2020 predominately driven by lower transient parking revenues in both of our regions as previously mentioned as well as lower weighted average occupancy in Other markets, partially offset by higher in-place net rents in both of our regions.
-
NAV per unit(1): As at June 30, 2020, our NAV per unit was $27.61, compared to $27.13 at March 31, 2020 and $25.49 at June 30, 2019, up $0.48 or 1.8% and $2.12 or 8.3%, respectively.
The quarter-over-quarter and year-over-year increase in NAV per unit of $0.48 and $2.12, respectively, was primarily due to cash flow retention from operations (diluted FFO net of distributions) and fair value uplifts in our Toronto downtown investment properties partially offset by fair value losses in our Other markets investment properties, primarily in Western Canada. For the second quarter of 2020, the fair value gains in our Toronto downtown investment properties were $20.3 million, supported by third-party appraisals on five investment properties in the region.
NAV per unit is considered one of the Trust’s key metrics and has increased consistently over the past 13 quarters as we improve the quality of our assets and the value of the business.
BUSINESS UPDATE
The COVID-19 pandemic has caused significant economic and social disruptions to all businesses and daily life. At this time, the duration and extent of the pandemic, the impact it may have on the financial performance of the Trust in 2020 and whether it will have any long-term impact on our business is still uncertain. Since we announced the launch of our strategic plan in 2016, we have transformed Dream Office REIT into a safer, higher quality company. As a result of these initiatives, we believe Dream Office REIT is currently well positioned, with a portfolio of exceptional real estate, primarily located in downtown Toronto, combined with a strong balance sheet and ample liquidity.
As at June 30, 2020, the Trust had approximately $214 million of available liquidity(1), $240 million of unencumbered assets(1) and a level of debt (net total debt-to-net total assets)(1) of 38.3%, down from 45.4% at June 30, 2019. The Trust has only one mortgage totalling $14.5 million in downtown Toronto to refinance during the second half of 2020. In addition, over 72% or 0.4 million square feet of total 2020 portfolio expiries have been committed.
Despite COVID-19’s disruption to the leasing market and physical distancing measures currently in place, the Trust is managing an active pipeline of renewals and new leases with existing and prospective tenants. During the COVID-19 period from March to July 2020, we have leased over 250,000 square feet across our portfolio at a weighted average net rent of $37.41 per square foot, or over 40% above the weighted average expiring net rent on the space. In addition, we are currently working on over 400,000 square feet of leasing deals across the portfolio at rents in line with pre-COVID rates.
We believe our near-term financial and operational exposures are very manageable.
The following table summarizes selected operational statistics with respect to the second quarter of 2020, all presented as a percentage of recurring contractual gross rent by month as at August 6, 2020:
SELECTED OPERATIONAL STATISTICS |
|
Cash |
|
|
|
CECRA program |
|
|
|
Deferral |
|
|
|
|
|
(unaudited) |
|
collected |
|
|
|
receivables |
|
|
|
arrangements |
|
|
|
Outstanding* |
|
April 2020 |
|
92.7% |
|
|
|
2.7% |
|
|
|
0.5% |
|
|
|
4.1% |
|
May 2020 |
|
91.5% |
|
|
|
2.7% |
|
|
|
1.4% |
|
|
|
4.4% |
|
June 2020 |
|
88.7% |
|
|
|
2.8% |
|
|
|
3.8% |
|
|
|
4.7% |
|
Q2 2020 |
|
91.0% |
|
|
|
2.7% |
|
|
|
1.9% |
|
|
|
4.4% |
|
July 2020 |
|
90.1% |
|
|
|
2.7% |
|
|
|
2.4% |
|
|
|
4.8% |
|
* Includes the 25% of recurring contractual gross rent that the Trust expects to forgive under the CECRA program. |
Since the COVID-19 pandemic was announced, our tenant relations team has been in touch with our tenants on a bi-weekly basis, updating them on new government programs and Dream initiatives to prepare our buildings for their return. We have been educating tenants on government-led relief initiatives and assisting tenants with back to work planning for their employees. In certain instances, the Trust has granted deferrals and rent repayment arrangements to select tenants on a case-by-case basis. It is the Trust’s intention to support our tenants through the COVID-19 pandemic so they can recover quickly with an economically viable business for the long term.
We are actively working with smaller tenants who qualify for the Canada Emergency Commercial Rent Assistance (“CECRA”) program operated jointly by the federal and provincial governments. Tenants who are eligible for CECRA are those who pay less than $50,000 in gross rent per month, generate less than $20 million in revenues at a corporate level and have experienced a decline in revenues of at least 70% during the months of April to June. We currently anticipate approximately 100 tenant applications to participate in the CECRA program. The CECRA program receivables in the table above represent the unpaid portion of the 25% rent the tenant applicant is required to cover and the 50% that we expect to receive from the government upon approval of the CECRA applications. The Trust has collected the majority of the 25% rent that tenant applicants owe to the Trust.
We have also agreed to work with certain tenants representing approximately 1.9% of the second quarter’s recurring contractual gross rent by deferring their gross rent for a period of time to help their business. The current weighted average deferral period on current arrangements is approximately eight months.
As at June 30, 2020, the Trust has recorded COVID-related provisions totalling approximately $1.5 million, which are included in the line item “COVID-related provisions and adjustments” within net rental income. This provisions balance represents an estimate of potential credit losses on our trade receivables for all uncollected rent as at June 30, 2020 along with the 25% of recurring contractual gross rent that the Trust expects to forgive, subject to participating tenants’ eligibility for participation in the CECRA program. Partially offsetting the impact of provisions included in “COVID-related provisions and adjustments” is the impact of government programs totalling $1.2 million that the Trust qualified for during the second quarter and collected subsequent to the quarter.
“We are pleased with our progress in collecting rents, supporting our tenants and leasing space through these difficult months,” said Michael J. Cooper, Chief Executive Officer of Dream Office REIT. “We are confident that the buildings we own today will remain competitive and desirable to attract above market rents and quality tenants for the long term.”
CAPITAL HIGHLIGHTS
KEY FINANCIAL PERFORMANCE METRICS |
As at |
|
||||||||||||||
(unaudited) |
June 30, |
|
March 31, |
|
December 31, |
|
June 30, |
|
||||||||
|
2020 |
|
2020 |
|
2019 |
|
2019 |
|
||||||||
Financing |
|
|
|
|
|
|
|
|
||||||||
Weighted average face rate of interest on debt (period-end)(5) |
3.68% |
|
3.78% |
|
3.88% |
|
3.94% |
|
||||||||
Interest coverage ratio (times)(1) |
3.1 |
|
3.0 |
|
2.9 |
|
2.8 |
|
||||||||
Net total debt-to-adjusted EBITDAFV (years)(1) |
8.1 |
|
7.8 |
|
7.5 |
|
8.5 |
|
||||||||
Level of debt (net total debt-to-net total assets)(1) |
38.3% |
|
38.5% |
|
37.6% |
|
45.4% |
|
||||||||
Average term to maturity on debt (years) |
4.6 |
|
5.1 |
|
4.7 |
|
4.7 |
|
||||||||
Available liquidity and unencumbered assets |
|
|
|
|
|
|
|
|
||||||||
Available liquidity (in millions)(1) |
$ |
213.9 |
|
$ |
218.6 |
|
$ |
413.6 |
|
$ |
351.4 |
|
||||
Unencumbered assets (in millions)(1)(6) |
239.7 |
|
222.3 |
|
281.3 |
|
146.4 |
|
||||||||
See footnotes at end.
- REIT A Units purchased for cancellation: In 2020, the Trust has purchased for cancellation 1,411,650 REIT A Units under the NCIB, at a cost of approximately $26.2 million or $18.58 per unit. We believe that the market price of our units since March has not reflected the intrinsic value of the Trust and the units represented an attractive investment opportunity. Accordingly, the Trust has been purchasing units for cancellation and is prepared to continue to purchase units through its NCIB program as market conditions warrant.
“Our financial position and liquidity are in good shape to withstand near-term disruptions from COVID,” said Jay Jiang, Chief Financial Officer of Dream Office REIT. “We created a strong balance sheet from the sale of non-core assets outside of downtown Toronto over the past five years and now we feel confident in the long-term value and performance of the portfolio we own today.”
OPERATIONAL HIGHLIGHTS
SELECTED OPERATIONAL INFORMATION |
As at |
|
||||||||||
(unaudited) |
June 30, |
|
March 31, |
|
June 30, |
|
||||||
|
2020 |
|
2020 |
|
2019 |
|
||||||
Comparative portfolio(7) |
|
|
|
|
|
|
||||||
Occupancy rate - including committed (period-end) |
88.3% |
|
89.9% |
|
90.8% |
|
||||||
Occupancy rate - in-place (period-end) |
87.8% |
|
89.1% |
|
88.9% |
|
||||||
Average in-place and committed net rent per square foot (period-end) |
$ |
23.00 |
|
$ |
22.66 |
|
$ |
22.42 |
|
|||
Weighted average lease term (years) |
5.3 |
|
5.3 |
|
5.2 |
|
||||||
See footnotes at end.
-
In-place occupancy: Comparative portfolio in-place occupancy on a quarter-over-quarter basis decreased to 87.8%, compared to 89.1% at Q1 2020, primarily due to the expiry of a temporary lease in Western Canada and a 55,000 square foot bankruptcy of industrial space which predated COVID at 2200-2206 Eglinton Avenue East and 1020 Birchmount Road in the Greater Toronto Area. Net rents on the space occupied by the bankrupt tenant were $4.00 per square foot which we believe are well below market rates for industrial space in the current market, presenting an opportunity for us to surface additional value.
Comparative portfolio in-place occupancy on a year-over-year basis decreased to 87.8% from 88.9% at Q2 2019. In the Other markets region, Saskatchewan saw 64,000 square feet of net negative absorption from expiries, and the Greater Toronto Area had 17,000 square feet of net negative absorption primarily due to the previously mentioned bankruptcy offset by net positive absorption through the remainder of that geographic area. Toronto downtown in-place occupancy was flat relative to the prior year. In Saskatchewan, we are engaging with prospective tenants for approximately 150,000 square feet of currently vacant space.
- Lease commencement & leasing update: For the three and six months ended June 30, 2020, approximately 55,000 square feet and 122,000 square feet, respectively, of leases commenced, not including temporary leases. Rental rates on renewals and relocations over the respective periods were 36% and 23% above expiring rates, predominately due to positive leasing spreads on renewals in Toronto downtown, partially offset by some negative leasing spreads on renewals in Saskatchewan within Other markets.
- Tenant profile: As illustrated in the chart below, the Trust has a diversified and healthy tenant mix with over 20% of estimated annualized gross rental revenue from governments and government agencies. Our top 10 tenants make up more than 35% of gross rental revenue and 50% of our top tenants have credit ratings of A or higher.
See Figure 1, Estimated Annualized Gross Rental Revenue by Tenant Industry
NEW APPOINTMENT TO THE BOARD OF TRUSTEES
The Trust is pleased to announce that Deborah Starkman has been appointed to the Board of Trustees and a member of the Trust’s Audit Committee. Ms. Starkman was appointed to a term that expires at Dream Office REIT’s next annual meeting of unitholders.
Ms. Starkman was previously the Chief Financial Officer and Corporate Secretary of GMP Capital Inc. (GMP), which was one of Canada’s largest independent investment dealers. Ms. Starkman oversaw finance, operations, investor relations, human resources and information technology functions at the firm, including all aspects of regulatory and external financial reporting, performance measurement, risk management, liquidity and capital management and tax reporting.
Prior to joining GMP, she was Managing Director, Product Finance at the brokerage arm of a major Canadian bank. With over 25 years of experience in the capital markets industry, Ms. Starkman brings a deep level of knowledge and insight.
Over the course of her career Ms. Starkman has served on several charitable as well as industry related boards and committees including the Centennial Infant and Child Care Centre, the Investment Industry Association of Canada, Toronto Financial International and the Financial and Operational Executive Committee of the Investment Industry Regulatory Organization of Canada.
She has a Bachelor of Arts degree in Political Science from the University of Western Ontario, and a Bachelor of Commerce from the University of Windsor. Ms. Starkman is a Chartered Professional Accountant, holds a Chartered Financial Analyst designation and has received the ICD.D certification from the Institute of Corporate Directors. Ms. Starkman currently resides in Toronto.
CALL
Management will host a conference call to discuss the financial results tomorrow, August 7, 2020 at 10:00 a.m. (ET). To access the conference call, please dial 1-888-465-5079 in Canada and the United States or 416-216-4169 elsewhere and use passcode 5997 060#. To access the conference call via webcast, please go to Dream Office REIT’s website at www.dreamofficereit.ca and click on the link for News & Events, then click on Calendar of Events. A taped replay of the conference call and the webcast will be archived for 90 days.
OTHER INFORMATION
Information appearing in this news release is a selected summary of results. The condensed consolidated financial statements and Management’s Discussion and Analysis (“MD&A”) of the Trust are available at www.dreamofficereit.ca and on www.sedar.com.
Dream Office REIT is an unincorporated, open-ended real estate investment trust. Dream Office REIT owns well-located, high-quality central business district office properties in major urban centres across Canada, with a focus on downtown Toronto. For more information, please visit our website at www.dreamofficereit.ca.
FOOTNOTES
(1) |
FFO, comparative properties NOI, diluted FFO per unit, NAV per unit, available liquidity, unencumbered assets, level of debt (net total debt-to-net total assets), interest coverage ratio and net total debt-to-adjusted EBITDAFV are non-GAAP measures used by management in evaluating operating and financial performance. Please refer to the cautionary statements under the heading “Non-GAAP Measures” in this press release. |
(2) |
A description of the determination of diluted amounts per unit can be found in section "Our Equity" under the heading “Weighted average number of units” of the MD&A for the three and six months ended June 30, 2020. |
(3) |
Total number of units includes 5.2 million LP B Units which are classified as a liability under IFRS. |
(4) |
Excludes properties held for sale and joint ventures that are equity accounted at the end of each period, as applicable. |
(5) |
Weighted average face rate of interest on debt is calculated as the weighted average face rate of all interest bearing debt balances excluding debt in joint ventures that are equity accounted. |
(6) |
Unencumbered assets as at June 30, 2019 has been restated to conform to current period presentation. For further details, please refer to the “Non-GAAP Measures” section under the heading “Unencumbered assets” in Dream Office REIT’s MD&A for the three and six months ended June 30, 2020. |
(7) |
Comparative portfolio excludes acquired properties, properties sold, properties under development and joint ventures that are equity accounted as at June 30, 2020. Acquired properties and properties under development are excluded from comparative properties NOI until they have been operating for two full calendar years. Acquired properties comprises 6 Adelaide Street East, Toronto downtown which was acquired on September 12, 2019. |
NON-GAAP MEASURES
The Trust’s condensed consolidated financial statements are prepared in accordance with International Financial Reporting Standards (“IFRS”). In this press release, as a complement to results provided in accordance with IFRS, the Trust discloses and discusses certain non-GAAP financial measures, including FFO, comparative properties NOI, diluted FFO per unit, NAV per unit, available liquidity, unencumbered assets, level of debt (net total debt-to-net total assets), interest coverage ratio and net total debt-to-adjusted EBITDAFV, as well as other measures discussed elsewhere in this release. These non-GAAP measures are not defined by IFRS, do not have a standardized meaning and may not be comparable with similar measures presented by other income trusts. The Trust has presented such non-GAAP measures as Management believes they are relevant measures of the Trust’s underlying operating performance and debt management. Non-GAAP measures should not be considered as alternatives to net income, net rental income, cash flows generated from (utilized in) operating activities, cash and cash equivalents, total assets, non-current debt, total equity, or comparable metrics determined in accordance with IFRS as indicators of the Trust’s performance, liquidity, cash flow, and profitability. For a full description of these measures and, where applicable, a reconciliation to the most directly comparable measure calculated in accordance with IFRS, please refer to the “Non-GAAP Measures” section in Dream Office REIT’s MD&A for the three and six months ended June 30, 2020.
FORWARD LOOKING INFORMATION
This press release may contain forward-looking information within the meaning of applicable securities legislation, including statements regarding our objectives and strategies to achieve those objectives, asset management strategies, future development plans, the future composition of our portfolio, future purchases of units through its NCIB program, the terms of and duration of secured tenant renewals, the timing of committed occupancies, renewal and leasing assumptions, estimated market rents and our capital program. Forward-looking information is based on a number of assumptions and is subject to a number of risks and uncertainties, many of which are beyond Dream Office REIT’s control, which could cause actual results to differ materially from those that are disclosed in or implied by such forward-looking information. These risks and uncertainties include, but are not limited to, general and local economic and business conditions; employment levels; mortgage and interest rates and regulations; the uncertainties around the timing and amount of future financings; uncertainties surrounding the COVID-19 pandemic; the ability of the Trust to access government programs; the financial condition of tenants; our ability to refinance maturing debt; leasing risks, including those associated with the ability to lease vacant space; rental rates on future leasing; and interest and currency rate fluctuations. Our objectives and forward-looking statements are based on certain assumptions, including that the general economy remains stable, interest rates remain stable, conditions within the real estate market remain consistent, competition for acquisitions remains consistent with the current climate and that the capital markets continue to provide ready access to equity and/or debt. All forward-looking information in this press release speaks as of the date of this press release. Dream Office REIT does not undertake to update any such forward-looking information whether as a result of new information, future events or otherwise except as required by law. Additional information about these assumptions and risks and uncertainties is contained in Dream Office REIT’s filings with securities regulators, including its latest annual information form and MD&A. These filings are also available at Dream Office REIT’s website at www.dreamofficereit.ca.
View source version on businesswire.com: https://www.businesswire.com/news/home/20200806006087/en/
Michael J. Cooper
Chairman and Chief Executive Officer
(416) 365-5145
[email protected]
Jay Jiang
Chief Financial Officer
(416) 365-6638
[email protected]
Please make the indicated changes including the new text: US quotes snapshot data provided by IEX. Additional price data and company information powered by Twelve Data.