
Dream Industrial REIT Reports Strong Q4 2021 and Year-End Financial Results
Dream Industrial REIT (DIR.UN-TSX) (the “Trust” or “DIR” or the “REIT” or “we”) today announced its financial results for the three months and year ended December 31, 2021. Management will host a conference call to discuss the financial results on February 16, 2022 at 11:00 a.m. (ET).
This press release features multimedia. View the full release here: https://www.businesswire.com/news/home/20220215006070/en/
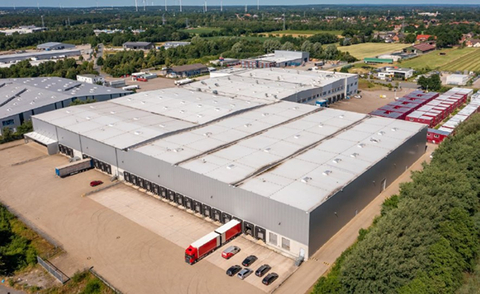
Hamburg Asset (Photo: Business Wire)
HIGHLIGHTS
- Net income was $190.0 million in Q4 2021, a 133% increase when compared to $81.5 million in Q4 2020. On a year-over-year basis, net income was $608.3 million in 2021, a 204% increase when compared to $200.1 million in 2020;
- Diluted funds from operations (“FFO”) per Unit(1) was $0.21 in Q4 2021, a 13.4% increase when compared to Q4 2020, where the FFO per Unit was $0.19. On a year-over-year basis, diluted FFO per Unit was $0.81 in 2021, a 15.4% increase when compared to $0.71 in 2020;
- Net rental income was $60.4 million in Q4 2021, a 35.8% increase when compared to $44.5 million in Q4 2020. On a year-over-year basis, net rental income was $217.9 million in 2021, a 29.0% increase when compared to $168.9 million in 2020;
- Comparative properties net operating income (“CP NOI”) (constant currency basis)(2) was $40.1 million in Q4 2021, a 7.6% increase when compared to $37.3 million in Q4 2020. The Canadian portfolio posted a year-over-year CP NOI growth of 8%, predominantly driven by 17% and 5.2% CP NOI increases in Ontario and Québec, respectively. For the full year, CP NOI was $138.0 million for the year 2021, a 5.4% increase when compared to $131.0 million in 2020;
- Total assets were $6.1 billion in Q4 2021, a 71.9% increase when compared to $3.5 billion in Q4 2020;
- Total equity (per consolidated financial statements) was $3.5 billion in Q4 2021, an 83.7% increase when compared to $1.9 billion in Q4 2020;
- Net asset value (“NAV”) per Unit(3) was $15.13 in Q4 2021, a 20.6% increase when compared to Q4 2020, where the NAV per Unit was $12.55; and
- Investment property values increased quarter-over-quarter due to $141.8 million in fair value gains recognized in Q4 2021, reflecting higher market rents, strong leasing activity, and compression in capitalization rates in Québec and Ontario;
(1) Diluted FFO per Unit is a non-GAAP ratio. Diluted FFO per Unit is comprised of FFO (a non-GAAP financial measure) divided by the weighted average number of Units. For further information on this non-GAAP ratio, please refer to the statements under the heading “Non-GAAP financial measures, ratios and supplementary financial measures” in this press release. |
(2) Comparative properties net operating income (“CP NOI”) (constant currency basis) is a non-GAAP financial measure. The most directly comparable financial measure to CP NOI (constant currency basis) is net rental income. The tables included in the Appendices section of this press release reconcile CP NOI (constant currency basis) for the three months and years ended December 31, 2021 and December 31, 2020 to net rental income. For further information on this non-GAAP financial measure, please refer to the statements under the heading “Non-GAAP financial measures, ratios and supplementary financial measures” in this press release. |
(3) NAV per Unit is a non-GAAP ratio. NAV per Unit is comprised of total equity (including LP B Units) (a non-GAAP financial measure) divided by the number of Units. For further information on this non-GAAP ratio, please refer to the statements under the heading “Non-GAAP financial measures, ratios and supplementary financial measures” in this press release. |
-
The Trust continues to make significant progress on strategic initiatives to maximize organic and external growth drivers while maintaining a strong and flexible balance sheet.
-
Organic growth: Leasing momentum continues to remain robust, which along with strong rental rate growth has allowed the Trust to significantly enhance the organic growth profile of its portfolio over the long term. Since the beginning of 2021, the Trust has signed approximately five million square feet of leases at an average spread of 19%.
Since the end of Q3 2021, the Trust has addressed approximately 1.9 million square feet of leases at an average rental spread of 20% over prior/expiring rents. In addition, there are 1.0 million square feet of leases commencing in 2022 at an average spread of 26%, committed prior to Q3 2021. The Trust’s leasing momentum has resulted in a 260 basis points increase in in-place and committed occupancy from 95.6% as at December 31, 2020, to 98.2% as at December 31, 2021.
Reflecting continued strength in demand for well-located logistics space, market rents across the Trust’s operating regions continue to increase. As at December 31, 2021, estimated market rents across the Trust’s portfolio exceeded the average in-place base rent by approximately 19%, compared to approximately 9% as of December 31, 2020.
-
Executing on development pipeline – Phase 1 of the Trust’s 226,000 square foot expansion at 401 Marie-Curie Boulevard in Montréal is substantially complete with the Trust signing a lease for the entire 130,000 square foot expansion, resulting in an unlevered yield on construction costs of 8.9%. The Trust has commenced construction or is in the final planning stages of commencing construction on over 700,000 square feet of projects in the next 60–90 days. In addition, the Trust expects its pipeline of projects under construction to accelerate in the coming quarters and is in planning stages to start construction on over one million square feet of projects in 2022 with additional projects slated to commence in 2023 and beyond.
At the same time, the Trust continues to expand its development pipeline. Since the end of Q3-2021, the Trust has acquired a 28-acre site in Cambridge for $26 million and a 50-acre site in the Balzac sub-market of Calgary for $14 million. In addition, it is under contract or in exclusivity on two sites in Calgary and the Great Toronto Area (“GTA”) totalling 30 acres. These sites should add an additional 1.6 million square feet to the Trust’s portfolio. Moreover, the Trust has added approximately 2.3 million square feet of incremental density potential with the acquisitions completed in 2021.
-
Strong pace of external growth – During the quarter, the Trust completed $474 million of income-producing property acquisitions across Canada and Europe, adding nearly 2.5 million square feet of gross leasable area (“GLA”) to the portfolio, with a weighted average capitalization rate ("cap rate”) of 4.3%. These assets were acquired below replacement cost in significantly land-constrained markets in Canada and Europe and are above the average quality of the Trust’s portfolio.
- Strengthening the balance sheet – During the quarter, the Trust issued $250 million of Series D Unsecured Debentures at a fixed interest rate of 0.54%, after swapping to euros. Net proceeds from this issuance are expected to be utilized towards eligible green investments under the Trust’s Green Financing Framework. During the quarter, The Trust completed a $287.7 million equity offering and raised $56.4 million through its at-the-market program (“ATM Program”). Proceeds were utilized to fund the approximately $500 million of acquisitions during the quarter, development costs, and for general trust purposes.
-
Organic growth: Leasing momentum continues to remain robust, which along with strong rental rate growth has allowed the Trust to significantly enhance the organic growth profile of its portfolio over the long term. Since the beginning of 2021, the Trust has signed approximately five million square feet of leases at an average spread of 19%.
FINANCIAL HIGHLIGHTS
SELECTED FINANCIAL INFORMATION |
|
|
|
|
|
|
|
|
(unaudited) |
Three months ended |
|
Year ended |
|||||
|
|
December 31, |
|
December 31, |
|
December 31, |
|
December 31, |
(in thousands of dollars except per Unit amounts |
|
2021 |
|
2020 |
|
2021 |
|
2020 |
Operating results |
|
|
|
|
|
|
|
|
Net rental income |
$ |
60,432 |
$ |
44,512 |
$ |
217,899 |
$ |
168,883 |
Comparative properties net operating income (“NOI”) (constant currency basis)(1) |
|
40,096 |
|
37,252 |
|
138,032 |
|
131,010 |
Net income |
|
189,971 |
|
81,513 |
|
608,345 |
|
200,136 |
Funds from operations (“FFO”)(2) |
|
52,033 |
|
31,935 |
|
176,616 |
|
119,646 |
Per Unit amounts |
|
|
|
|
|
|
|
|
FFO – diluted(3)(4) |
$ |
0.21 |
$ |
0.19 |
$ |
0.81 |
$ |
0.71 |
Distribution rate |
|
0.17 |
|
0.17 |
|
0.70 |
|
0.70 |
See footnotes at end. |
|
|
|
|
|
|
|
|
PORTFOLIO INFORMATION |
|
|
|
|
(unaudited) |
|
As at |
||
|
|
December 31, |
|
December 31, |
(in thousands of dollars) |
|
2021 |
|
2020 |
Total portfolio |
|
|
|
|
Number of assets(5)(6) |
|
239 |
|
177 |
Investment properties fair value |
$ |
5,696,607 |
$ |
3,241,601 |
Gross leasable area (“GLA”) (in millions of sq. ft.)(6) |
|
43.0 |
|
27.3 |
Occupancy rate – in-place and committed (period-end)(7) |
|
98.2% |
|
95.6% |
Occupancy rate – in-place (period-end)(7) |
|
97.7% |
|
94.7% |
See footnotes at end. |
|
|
|
|
FINANCING AND CAPITAL INFORMATION |
|
|
|
|
(unaudited) |
|
As at |
||
|
|
December 31, |
|
December 31, |
(in thousands of dollars except per Unit amounts) |
|
2021 |
|
2020 |
FINANCING |
|
|
|
|
Credit rating – DBRS |
|
BBB (mid) |
|
BBB (mid) |
Net total debt-to-total assets (net of cash and cash equivalents) ratio(8) |
|
31.4% |
|
31.3% |
Net total debt-to-normalized adjusted EBITDAFV ratio (years)(9) |
|
8.0 |
|
6.2 |
Interest coverage ratio (times)(10) |
|
8.0 |
|
4.4 |
Weighted average face interest rate on debt |
|
0.83% |
|
2.57% |
Weighted average remaining term to maturity on debt (years) |
|
3.8 |
|
4.8 |
Unencumbered investment properties(11) |
$ |
4,154,925 |
$ |
1,441,589 |
Cash and cash equivalents |
$ |
164,015 |
$ |
254,935 |
Available liquidity (period-end)(12) |
$ |
511,612 |
$ |
573,235 |
CAPITAL |
|
|
|
|
Total equity (per consolidated financial statements) |
$ |
3,499,423 |
$ |
1,904,876 |
Total equity (including LP B Units)(13) |
$ |
3,818,886 |
$ |
2,148,833 |
Total number of Units (in thousands)(14) |
|
252,417 |
|
171,231 |
Net asset value (“NAV”) per Unit(15) |
$ |
15.13 |
$ |
12.55 |
Unit price |
$ |
17.22 |
$ |
13.15 |
See footnotes at end. |
|
|
|
|
“Dream Industrial achieved significant milestones during 2021 and is well-positioned to outperform in 2022 and beyond,” said Brian Pauls, Chief Executive Officer of Dream Industrial REIT. “With a $6 billion global industrial portfolio located in some of the tightest industrial markets, we are well-positioned to drive significant rental rate and NAV per Unit growth. At the same time, our deep development pipeline and excess density across our operating markets will allow us to continue to high-grade our portfolio and provides a strong complement to our acquisition strategy. Our global presence allows us to access capital in the most optimal geography and positions us to maintain our strong growth trajectory. While our accomplishments have led DIR to become a significantly larger and more valuable business, we look to future opportunities and continue to focus on creating significant long-term value for our unitholders.”
ORGANIC GROWTH
-
Robust leasing momentum at attractive rental spreads and solid contractual rent growth – Since the beginning of 2021, the Trust has signed approximately 3.6 million square feet of new leases and renewals in Canada at an average spread of 21.2%. In Europe, the Trust has signed 1.2 million square feet at a 10.5% spread over prior/expiring rents. Since the end of Q3 2021, the Trust has already addressed approximately 1.9 million square feet of 2022 expiries.
- In Canada, the Trust signed approximately 600,000 square feet of leases expected to commence in 2022 at an average spread of 30%; and
- In Europe, the Trust signed 1.3 million square feet of leases expected to commence in 2022 at an average spread of 12%.
-
Furthermore, one million square feet of new leases and renewals commencing in 2022 were committed prior to Q3 2021, at an average spread of 26% and an additional 1.4 million square feet of new lease and renewals commenced in the second half of 2021 at an average spread of 15%.
Along with generating significant rental rate growth, the Trust is programmatically adding contractual annual rental rate escalators to its leases that allow for consistently rising net operating income over time. Currently, the average contractual rent growth embedded in the Trust’s Canadian portfolio equates to 2.4%. In the Trust’s European portfolio, approximately 90% of the leases are indexed to the consumer price index and an additional 8% have an average contractual rent growth of 2%.
Historically low availability rates and rising replacement costs have resulted in a strong outlook for rental rates across the Trust’s operating markets. As at December 31, 2021, market rents exceed the average in-place base rent across the Trust’s portfolio by approximately 19%, compared to approximately 9% as of December 31, 2020.
Since the end of Q3 2021, the Trust continued to successfully execute on its asset management strategy to increase cash flow growth from its portfolio.- In January 2022, the Trust signed a lease for the entire 130,000 square foot Phase 1 expansion at its Marie-Curie property in Québec, which resulted in an unlevered yield on construction cost of approximately 9%. The lease will commence in April 2022; and
- At the Trust’s 60 Steckle property in Ontario, the Trust is completing a value-add refurbishment. The Trust acquired the 100,000 square foot property vacant in Q2 2021 for a total purchase price of $12 million. The Trust expects to spend approximately $2 million in value-add capital improvements and expects to generate an unlevered yield on cost of approximately 7.5%, with stabilization expected in May 2022.
-
Solid pace of CP NOI (constant currency basis)(1) growth – CP NOI (constant currency basis) for the three months and year ended December 31, 2021 increased by 7.6% and 5.4%, respectively, when compared to the prior year comparative periods.
The growth in CP NOI (constant currency basis) was led by a 17% and 12.3% year-over-year increase in CP NOI in Ontario for the three months and year ended December 31, 2021, respectively. This was driven primarily by increasing rental spreads on new and renewed leases in Ontario where the average in-place base rent increased by 10% and 9.4%, respectively, along with a 360 and 150 basis points increase in average occupancy, respectively for the three months and year ended December 31, 2021. In Québec, a 3% increase in in-place base rent drove year-over-year CP NOI growth of 5.2%. CP NOI for Europe increased by 3.9% year-over-year, driven primarily by a 4.2% increase in in-place base rent.
Net rental income for the three months and year ended December 31, 2021 increased by $15.9 million, or 35.8%, and $49.0 million, or 29.0%, respectively, over the prior year comparative periods. The increase was mainly driven by the impact of acquired investment properties in 2021 and 2020, as well as comparative properties NOI (constant currency basis) growth in 2021, partially offset by the impact of disposed investment properties during 2021.
- Solar update – In line with the Trust’s sustainability initiatives, it is evaluating the addition of over 30,000 solar panels in Canada and Europe, encompassing over four million square feet of GLA. The Trust expects to commit approximately $15 million of capital towards this project over the near-to-medium term and achieve an unlevered yield on cost of over 8%. The Trust expects income from these projects to be realized in phases commencing in the latter half of 2022.
DEVELOPMENT
The Trust has initiated a structured development program that allows it to add high-quality assets to its portfolio in markets with steep barriers to entry.
- During the quarter, the Trust acquired a 28-acre land parcel in Cambridge for $26 million, which should support the development of approximately 420,000 square feet in the next 24 months. The site is well-located and is in close proximity to Highway 401 and allows the Trust to expand its footprint in the Kitchener-Waterloo-Cambridge sub-market which is attracting significant demand for logistics space. The Trust expects to achieve an unlevered yield on cost of approximately 5.3%; and
- In addition, the Trust acquired a 50-acre site in Calgary for $14 million and is under contract on another 20-acre site in Calgary for an expected purchase price of $12 million. These sites can support the development of approximately 800,000 square feet of modern urban logistics product. The purchase price for the two sites is expected to total approximately $27 million. The sites are located in the Balzac sub-market which is close to the airport and has excellent connectivity to major highways and downtown Calgary. The Trust expects unlevered yield on cost of approximately 6% on stabilization.
The Trust continues to make significant progress on its current pipeline of projects. Below is a summary of the key updates on the Trust’s development pipeline:
- 401 Marie-Curie Boulevard, Montréal: The first phase of the expansion at 401 Marie-Curie in the Greater Montréal Area is substantially complete and the Trust signed a lease for the 130,000 square foot expansion commencing April 2022, resulting in an unlevered yield on cost of approximately 8.9%. As part of the second phase, the Trust will add 96,000 square feet of warehouse space expected to be completed by the end of 2022. Overall, the Trust expects to add 226,000 square feet of additional GLA at the property, and achieve an unlevered yield of over 7% on the two-phase project;
- 100 East Beaver Creek, Richmond Hill: The Trust is currently underway on its 43,000 square foot expansion. The Trust expects completion in Q4 2022 with an expected unlevered yield on cost of over 9%;
- Dresden, Germany: The Trust has signed a contract to commence construction of a 241,000 square foot expansion at its existing property in Dresden, Germany. Completion is expected by the end of 2022 with an unlevered yield on cost of approximately 6.5%;
- Abbotside, Caledon: The Trust received the site plan approval for the construction of approximately 150,000 square feet of modern last mile logistics space on its recently acquired site located on Abbotside Drive in the GTA. The Trust commenced construction in January 2022, with completion expected in early 2023. The Trust expects to achieve an unlevered yield on cost of over 5.5%;
- Mississauga redevelopment: The Trust intends to build a 209,000 square foot building in one of the most sought-after sub-markets in the GTA West region. Construction is expected to commence in Q3 2022 with completion expected in 2023. The Trust is forecasting an unlevered yield on cost of over 5%; and
- Montréal expansion: The Trust is currently advancing a 120,000 square foot intensification project at an existing property in Montreal. The Trust has the opportunity to refurbish the existing building and significantly increase the GLA at the existing 200,000 square foot building. The Trust expects to commence construction on this expansion in Q2 2022 and is forecasting an unlevered yield on cost of over 6.5%.
ACQUISITIONS
Of the approximately $630 million of acquisitions that were firm, under contract, or in exclusive negotiations as of the date of the Trust’s press release (link) dated October 13, 2021, the Trust has closed on acquisitions totalling approximately $499 million in Q4 2021, representing a weighted average cap rate of 4.3% on income-producing properties acquired. These acquisitions have added 2.5 million square feet of high quality, well-located and functional logistics space to the Trust’s portfolio.
- The Trust closed on the previously announced 600,000 square foot urban logistics and high-tech industrial campus in The Hague, Netherlands (“Tech Park”) for a purchase price of €90 million ($129 million), equating to a going in cap rate of 4.6%. The Trust is currently underway on two pre-leased expansions for 65,000 square feet that are expected to be complete in early 2022. The cost of the expansion is forecasted to be €10 million with an estimated unlevered yield on cost of 6.2%. In addition, there is an additional 39,000 square feet of intensification potential. These expansion projects are expected to be finalized in 2022;
- The Trust acquired a portfolio of 11 logistics and light industrial assets totalling 1.0 million square feet located in the Greater Golden Horseshoe region in Ontario (“GGH Portfolio”) for a total purchase price of $160 million. The GGH Portfolio is 100% occupied by strong tenants primarily in the logistics, automotive, and consumer goods sectors, with a weighted average lease term of approximately 5.3 years. The average in-place rent is over 25% below market, allowing for growing cash flows over time. In addition, the portfolio also includes nearly 300,000 square feet of excess density that the Trust intends to develop over time;
- The Trust acquired a 250,000 square foot single-tenant building located in Hamburg, one of the most important logistics hubs in Germany and home to the third largest port in Europe. Built in 1999 with additional expansions completed in 2006 and 2011, the property is 100% occupied by a logistics user with a weighted average lease term of seven years. The building is situated on a 11.5-acre site, and there is potential to intensify the site by approximately 50,000 square feet; and
- Furthermore, the Trust completed the previously announced acquisitions of five income-producing assets in Germany and the Greater Toronto Area (“GTA”) totalling 0.7 million square feet for a total purchase price of $118 million. These sites contain over 300,000 square feet of excess density that the Trust intends to develop over time.
See Figure 1, Hamburg Asset
See Figure 2, GGH Portfolio
For the full year 2021, the Trust completed over $2.4 billion of acquisitions across North America and Europe, which resulted in 15 million square feet of assets being added to its portfolio. The pipeline for future acquisitions remains robust and the Trust is under contract or in varying stages of due diligence on approximately $400 million of assets in Canada and Europe.
“We continue to focus on maximizing performance in every aspect of our business supported by strengthening fundamentals for industrial real estate in our markets,” said Alexander Sannikov, Chief Operating Officer of Dream Industrial REIT. “We are seeing robust organic growth drivers in our portfolio including marking rents to market, executing on value-add strategies, built-in rent steps and indexation. We expect that our development program will be an increasingly meaningful contributor to our overall results. Our new acquisitions enhance our organic growth outlook through additional density and mark-to-market potential while improving the overall quality of our portfolio.”
CAPITAL STRATEGY
The Trust continues to maintain significant financial flexibility as it executes on its strategy to grow and upgrade portfolio quality. During the quarter, the Trust issued $250 million of Series D Unsecured Debentures with net proceeds expected to be allocated towards funding eligible green projects under the Trust’s Green Financing Framework. Over the past 24 months, the Trust has successfully transitioned its debt stack to be largely unsecured, with the proportion of secured debt(16) dropping to 9.3% of total assets and approximately 28% of total debt (non-GAAP financial measure), compared to 64.7% one year ago. On a year-over-year basis, average cost of debt decreased 174 basis points from 2.57% in Q4 2020 to 0.83% in Q4 2021.
During the quarter, the Trust completed a $287.7 million equity offering during the quarter at an issue price of $16.50. Since Q3 2021, the Trust has utilized its ATM Program to raise approximately $56.4 million, at an average unit price of $16.64. Subsequent to quarter-end, the Trust raised a further $43.2 million through the ATM Program at an average unit price of $16.27. The net proceeds from the equity offering as well as the ATM Program were utilized to fund over $500 million of acquisitions completed since the end of Q3 2021, over $20 million in development costs, and general trust purposes.
The Trust ended Q4 2021 with total available liquidity of $512 million, which provides sufficient capacity to execute on its acquisition and development pipeline while keeping leverage within its targeted range.
“We continue to execute on our strategy to grow and upgrade portfolio quality while maintaining a strong and flexible balance sheet,” said Lenis Quan, Chief Financial Officer of Dream Industrial REIT. “Our capital allocation strategy has allowed us to more than double our portfolio in under 24 months while keeping leverage in the low-to-mid 30% range, and growing FFO per unit and NAV significantly. We retain ample liquidity and balance sheet capacity to continue to improve the overall quality of our business.”
FINANCIAL HIGHLIGHTS
-
Net income for the quarter and year – For the three months ended December 31, 2021, the Trust recorded net income of $190 million consisting of net rental income of $60 million, fair value adjustments to investment properties of $142 million and cumulative other income and expenses of $7 million, partially offset by fair value adjustments to financial instruments of $19 million.
For the year ended December 31, 2021, the Trust recorded net income of $608 million consisting of net rental income of $218 million and fair value adjustments to investment properties of $586 million, partially offset by fair value adjustment to financial instruments of $112 million, cumulative other income and expenses of $52 million and debt settlement costs of $32 million.
- Diluted FFO per Unit(1) for the quarter and year – Diluted FFO per Unit for the three months and year ended December 31, 2021, was $0.21 and $0.81, respectively, compared to $0.19 and $0.71 for the three months and year ended December 31, 2020. The increases in the respective periods were primarily driven by comparative properties NOI (constant currency basis)(3) growth, NOI from acquired properties in 2021 and 2020 and lower interest expense as a result of the Trust’s debt strategy to reduce borrowing costs announced in early 2020. This was partially offset by an increase in G&A expenses from higher asset management fees and the growth of our European platform, disposition of properties in 2021 and dilution from timing of deployment of the Trust’s excess liquidity.
- Total equity (per consolidated financial statements) was $3.5 billion in Q4 2021, an 83.7% increase when compared to $1.9 billion in Q4 2020;
- NAV per Unit(2) – NAV per Unit as at December 31, 2021, increased by $2.58, or 20.6%, to $15.13 from $12.55 as at December 31, 2020, largely reflecting an increase in investment property values across the Trust’s portfolio as private market demand for industrial assets remains robust; and
-
Amendment to the Trust's Asset Management Agreement – Effective January 1, 2022, The Trust has amended its asset management agreement with Dream Asset Management Corporation ("DAM"), the Trust’s asset manager, to clarify certain definitions and simplify the administration of the agreement. The amendments do not materially change the overall financial impact to the Trust and DAM.
A Special Committee of the Board of Trustees was formed to evaluate the amendments. The Committee was advised by an independent financial and legal advisor, National Bank Financial and Goodmans LLP, respectively, and unanimously recommended approval of the amendments to the Board of Trustees. The principal amendments to the agreement include:- Change in Fiscal Year to match Trust’s year end – The fiscal year under the original agreement commenced every October 4th and ended October 3rd. The fiscal year end for the agreement has been updated to December 31st to align with the Trust’s financial reporting period so that the calculation of asset management fees align with the Trust’s publicly reported financial metrics in its quarterly and annual financial statements and MD&A;
- FFO per Unit replacing AFFO per Unit in calculations – FFO per Unit is published quarterly within the Trust’s financial disclosures and is a metric that is widely available and consistently calculated by analysts and investors. The adoption of an FFO per Unit standard is not expected to materially impact the management fees under the agreement as compared to the prior methodology;
- Incorporation of development activities – The original agreement did not contemplate greenfield development, expansions or redevelopments so the historical purchase price of the properties for the purposes of determining an incentive fee did not include development costs. With the Trust’s significant increase in development activities, the Trust has amended the agreement to include development costs in the calculation of the historical purchase price of its properties, which is expected to reduce incentive fees payable by the Trust in respect of development or redevelopment properties as compared to the prior methodology; and
- Separate contracts for North America and Europe – With the Trust’s expansion into Europe, the original agreement has been amended to separate the contracts between North America and Europe. The overall economics to the Trust and DAM will approximate the aggregate fees payable under the prior agreement. This amendment provides more flexibility to pursue future strategic initiatives, capital allocation decisions, and performance measurement across the Trust’s various operating regions.
CONFERENCE CALL
Senior management will host a conference call to discuss the financial results on Wednesday, February 16, 2022, at 11:00 a.m. (ET). To access the conference call, please dial 1-888-465-5079 in Canada or 416-216-4169 elsewhere and use passcode 7492 345#. To access the conference call via webcast, please go to Dream Industrial REIT’s website at www.dreamindustrialreit.ca and click on the link for News, then click on Events. A taped replay of the conference call and the webcast will be available for ninety (90) days following the call.
OTHER INFORMATION
Information appearing in this press release is a select summary of financial results. The consolidated financial statements and management’s discussion and analysis for the Trust will be available at www.dreamindustrialreit.ca and on www.sedar.com.
Dream Industrial REIT is an unincorporated, open-ended real estate investment trust. As at December 31, 2021, Dream Industrial REIT owns, manages and operates a portfolio of 239 industrial assets (351 buildings) comprising approximately 43 million square feet of gross leasable area in key markets across Canada, Europe, and the U.S. Dream Industrial REIT’s objective is to continue to grow and upgrade the quality of its portfolio which primarily consists of distribution and urban logistics properties and to provide attractive overall returns to its unitholders. For more information, please visit www.dreamindustrialreit.ca.
(1) Diluted FFO per Unit is a non-GAAP ratio. Diluted FFO per Unit is comprised of FFO (a non-GAAP financial measure) divided by the weighted average number of Units. For further information on this non-GAAP ratio, please refer to the statements under the heading “Non-GAAP financial measures, ratios and supplementary financial measures” in this press release. |
(2) NAV per Unit is a non-GAAP ratio. NAV per Unit is comprised of total equity (including LP B Units) (a non-GAAP financial measure) divided by the number of Units. For further information on this non-GAAP ratio, please refer to the statements under the heading “Non-GAAP financial measures, ratios and supplementary financial measures” in this press release. |
(3) Comparative properties net operating income (constant currency basis) is a non-GAAP financial measure. The most directly comparable financial measure to CP NOI is net rental income. The tables included in Appendices section of this press release reconcile CP NOI (constant currency basis) for the three months and years ended December 31, 2021 and December 31, 2020 to net rental income. For further information on this non-GAAP measure, please refer to the statements under the heading “Non-GAAP financial measures, ratios and supplementary financial measures” in this press release. |
FOOTNOTES
- Comparative properties net operating income (constant currency basis) (CP NOI (constant currency basis)) is a non-GAAP financial measure. The most directly comparable financial measure to CP NOI is net rental income. The tables included in the Appendices section of this press release reconcile CP NOI (constant currency basis) for the three months and years ended December 31, 2021 and December 31, 2020 to net rental income. For further information on this non-GAAP measure, please refer to the statements under the heading “Non-GAAP financial measures, ratios and supplementary financial measures” in this press release.
- FFO is a non-GAAP financial measure. The most directly comparable financial measure to FFO is net income. For further information on this non-GAAP measure, please refer to the statements under the heading “Non-GAAP financial measures, ratios and supplementary financial measures” in this press release. The table included in Appendices section of this press release reconcile FFO for the three months and years ended December 31, 2021 and December 31, 2020 to net income.
- Diluted FFO per Unit is a non-GAAP ratio. Diluted FFO per Unit is comprised of FFO (a non-GAAP financial measure) divided by the weighted average number of Units. For further information on this non-GAAP ratio, please refer to the statements under the heading “Non-GAAP financial measures, ratios and supplementary financial measures” in this press release.
- A description of the determination of diluted amounts per Unit can be found in the Trust’s Management’s Discussion and Analysis for the year ended December 31, 2021, in the section “Supplementary financial measures and ratios and other disclosures”, under the heading “Weighted average number of Units”.
- “Number of assets” comprise a building, or a cluster of buildings in close proximity to one another attracting similar tenants. Accordingly, the number of assets in prior periods has been revised to reflect the change in definition.
- Includes the Trust’s owned and managed properties as at December 31, 2021.
- Includes the Trust's share of equity accounted investments as at December 31, 2021.
- Net total debt-to-total assets (net of cash and cash equivalents) ratio is a non-GAAP ratio. Net total debt-to-total assets (net of cash and cash equivalents) ratio is comprised of net total debt (a non-GAAP financial measure) divided by total assets (net of cash and cash equivalents) (a non-GAAP financial measure). For further information on this non-GAAP ratio, please refer to the statements under the heading “Non-GAAP financial measures, ratios and supplementary financial measures” in this press release.
- Net total debt-to-normalized adjusted EBITDAFV ratio (years) is a non-GAAP ratio. Net total debt-to-normalized adjusted EBITDAFV is comprised of net total debt (a non-GAAP financial measure) divided by normalized adjusted EBITDAFV. For further information on this non-GAAP ratio, please refer to the statements under the heading “Non-GAAP financial measures and ratios and supplementary financial measures” in this press release.
- Interest coverage ratio (times) is a non-GAAP ratio. Interest coverage ratio is comprised of trailing 12-month period adjusted EBITDAFV (a non-GAAP financial measure) divided by interest expense on debt and other financing costs. For further information on this non-GAAP ratio, please refer to the statements under the heading “Non-GAAP financial measures and ratios and supplementary financial measures” in this press release.
- Unencumbered investment properties is a supplementary financial measure. For further information on this supplementary financial measure, please refer to the statements under the heading “Non-GAAP financial measures, ratios and supplementary financial measures” in this press release.
- Available liquidity is a non-GAAP financial measure. The most directly comparable financial measure to available liquidity is cash and cash equivalents. For further information on this non-GAAP measure, please refer to the statements under the heading “Non-GAAP financial measures, ratios and supplementary financial measures” in this press release. The table included in Appendices section of this press release reconciles available liquidity to cash and cash equivalents as at December 31, 2021 and December 31, 2020.
- Total equity (including LP B Units) is a non-GAAP financial measure. The most directly comparable financial measure to total equity (including LP B Units) is total equity (per consolidated financial statements). For further information on this non-GAAP measure, please refer to the statements under the heading “Non-GAAP financial measures, ratios and supplementary financial measures” in this press release. The table included in Appendices section of this press release reconciles total equity (including LP B Units) to total equity (per consolidated financial statements) as at December 31, 2021 and December 31, 2020.
- Total number of Units includes 18.6 million LP B Units that are classified as a liability under IFRS.
- NAV per Unit is a non-GAAP ratio. NAV per Unit is comprised of total equity (including LP B Units) (a non-GAAP financial measure) divided by the total number of Units. For further information on this non-GAAP ratio, please refer to the statements under the heading “Non-GAAP financial measures, ratios and supplementary financial measures” in this press release.
- Secured debt is a supplementary financial measure. Please refer to the statements under the heading “Non-GAAP financial measures, ratios and supplementary financial measures” in this press release.
Non-GAAP financial measures and ratios and supplementary financial measures
The Trust’s consolidated financial statements are prepared in accordance with International Financial Reporting Standards (“IFRS”). In this press release, as a complement to results provided in accordance with IFRS, the Trust discloses and discusses certain non-GAAP financial measures and ratios, including FFO, diluted FFO per Unit, CP NOI (constant currency basis), total debt, net total debt-to-total assets (net of cash and cash equivalents) ratio, net total debt-to-normalized adjusted EBITDAFV ratio, interest coverage ratio, available liquidity, total equity (including LP B Units) and NAV per Unit as well as other measures discussed elsewhere in this press release. These non-GAAP financial measures and ratios are not defined by IFRS and do not have a standardized meaning under IFRS. The Trust’s method of calculating these non-GAAP financial measures and ratios may differ from other issuers and may not be comparable with similar measures presented by other income trusts. The Trust has presented such non-GAAP financial measures and ratios as Management believes they are relevant measures of the Trust’s underlying operating and financial performance. Certain additional disclosures such as the composition, usefulness and changes, as applicable, of the non-GAAP financial measures and ratios included in this press release have been incorporated by reference from the management’s discussion and analysis of the financial condition and results from operations of the REIT for the three months and year ended December 31, 2021, dated February 15, 2022 (the “MD&A for the fourth quarter of 2021”) and can be found under the sections “Non-GAAP Financial Measures" and "Non-GAAP Ratios” and respective sub-headings labelled “Funds from operations (“FFO”)”, "Diluted FFO per Unit", "Comparative properties NOI (constant currency basis)”, “Net total debt-to-total assets (net of cash and cash equivalents) ratio”, “Net total debt-to-normalized adjusted EBITDAFV”, and “Interest coverage ratio”, “Available Liquidity”, "Total equity (including LP B Units or subsidiary redeemable units") and “Net asset value (“NAV”) per Unit”. The composition of supplementary financial measures included in this press release have been incorporated by reference from the MD&A for the fourth quarter of 2021 and can be found under the section “Supplementary financial measures and ratios and other disclosures”. The MD&A for the fourth quarter of 2021 is available on SEDAR at www.sedar.com under the Trust’s profile and on the Trust’s website at www.dreamindustrialreit.ca under the Investors section. Non-GAAP financial measures and ratios should not be considered as alternatives to net income, net rental income, cash flows generated from (utilized in) operating activities, cash and cash equivalents, total assets, non-current debt, total equity, or comparable metrics determined in accordance with IFRS as indicators of the Trust’s performance, liquidity, cash flow, and profitability.
Forward looking information
This press release may contain forward-looking information within the meaning of applicable securities legislation, including statements regarding the Trust’s objectives and strategies to achieve those objectives; the Trust’s ability to acquire high-quality assets; the Trust’s ability to deliver attractive overall returns to its unitholders the anticipated timing of closing of the acquisitions referred to in this press release, including the anticipated closing, purchase price and value of acquisitions under contract or in exclusivity; the ability of the Trust to maintain exclusive negotiations on certain assets and the Trust’s ability to close on such negotiations; the Trust’s acquisition pipeline; expectations regarding cash flow and growing cash flow over time; the Trust’s ability to access capital and to maintain its strong growth trajectory; the Trust’s ability to drive significant rental rate and NAV per Unit growth; the pro forma composition of the Trust’s portfolio after the completion of the acquisitions and potential development opportunities; the Trust’s development, expansion and redevelopment plans, including the timing of construction and expansion, expectations regarding stabilization of expansions, timing of completion of the Trust’s developments and anticipated yields; the anticipated commencement of certain leases and the average spread thereof and the Trust’s ability to maintain annual rental rate escalators in future leases and renewals; ability to lease completed developments; the addition of solar panels by the Trust, including the expected capital commitment towards such projects, the number of solar panels to be added, the timing of such projects, anticipated yields on cost and any income to be realized from such projects; expected interest rates and costs of debt including after any cross-currency interest rate swap; the use of net proceeds from any financings, including the net proceeds from the issuance of Series D Unsecured Debentures to be utilized towards eligible green investments under the Trust’s Green Financing Framework; expected debt and liquidity levels and unencumbered investment properties pool and the Trust’s ability to outperform in 2022 and beyond. Forward-looking information is based on a number of assumptions and is subject to a number of risks and uncertainties, many of which are beyond the Trust’s control, which could cause actual results to differ materially from those that are disclosed in or implied by such forward-looking information. These risks and uncertainties include, but are not limited to, general and local economic and business conditions; employment levels; mortgage and interest rates and regulations; the uncertainties around the timing and amount of future financings; uncertainties surrounding the COVID-19 pandemic; the financial condition of tenants; leasing risks, including those associated with the ability to lease vacant space; rental rates and the strength of rental rate growth on future leasing; and interest and currency rate fluctuations. The Trust’s objectives and forward-looking statements are based on certain assumptions, including that the general economy remains stable, interest rates remain stable, conditions within the real estate market remain consistent, historically low rates and rising replacement costs in the Trust’s operating markets remain steady, competition for acquisitions remains consistent with the current climate and that the capital markets continue to provide ready access to equity and/or debt. All forward-looking information in this press release speaks as of the date of this press release. The Trust does not undertake to update any such forward-looking information whether as a result of new information, future events or otherwise except as required by law. Additional information about these assumptions and risks and uncertainties is contained in the Trust’s filings with securities regulators, including its latest annual information form and MD&A. These filings are also available at the Trust’s website at www.dreamindustrialreit.ca.
Appendices
Reconciliation of CP NOI (constant currency basis) to net rental income
The tables below reconciles CP NOI (constant currency basis) for the three months and years ended December 31, 2021 and December 31, 2020 to net rental income.
|
Three months ended |
|||
|
December 31, |
|
December 31, |
|
(in thousands of dollars) |
|
2021 |
|
2020 |
Ontario |
$ |
14,032 |
$ |
11,994 |
Québec |
|
7,725 |
|
7,341 |
Western Canada |
|
10,998 |
|
10,985 |
Canadian portfolio |
|
32,755 |
|
30,320 |
European portfolio (constant currency basis) |
|
5,134 |
|
4,942 |
U.S. portfolio (constant currency basis) |
|
2,207 |
|
1,990 |
Comparative properties NOI (constant currency basis) |
|
40,096 |
|
37,252 |
Impact of foreign currency translation on comparative properties NOI |
|
— |
|
474 |
NOI from acquired properties – Canada |
|
4,145 |
|
— |
NOI from acquired properties - Europe |
|
17,219 |
|
148 |
NOI from acquired properties – U.S. |
|
415 |
|
— |
NOI from disposed share of properties |
|
(43) |
|
6,708 |
Net property management and other income |
|
237 |
|
— |
Straight-line rent |
|
1,293 |
|
263 |
Amortization of lease incentives |
|
(497) |
|
(436) |
Lease termination fees and other |
|
(136) |
|
51 |
COVID-19 related adjustments and provisions |
|
(63) |
|
52 |
Less: NOI from equity accounted investments |
|
(2,234) |
|
— |
Net rental income |
$ |
60,432 |
$ |
44,512 |
|
Year ended |
|||
|
December 31, |
|
December 31, |
|
(in thousands of dollars) |
|
2021 |
|
2020 |
Ontario |
$ |
43,635 |
$ |
38,869 |
Québec |
|
28,552 |
|
28,261 |
Western Canada |
|
43,449 |
|
43,229 |
Canadian portfolio |
|
115,636 |
|
110,359 |
U.S. portfolio (constant currency basis) |
|
22,396 |
|
20,651 |
Comparative properties NOI (constant currency basis) |
|
138,032 |
|
131,010 |
Impact of foreign currency translation on comparative properties NOI |
|
— |
|
1,877 |
NOI from acquired properties – Canada |
|
20,429 |
|
7,543 |
NOI from acquired properties – Europe |
|
59,820 |
|
17,270 |
NOI from acquired properties – U.S. |
|
1,468 |
|
— |
NOI from disposed share of properties |
|
(56) |
|
13,302 |
Net property management and other income |
|
554 |
|
— |
Straight-line rent |
|
2,998 |
|
1,674 |
Amortization of lease incentives |
|
(1,796) |
|
(1,645) |
Lease termination fees and other |
|
1,170 |
|
228 |
COVID-19 related adjustments and provisions |
|
(140) |
|
(2,376) |
Less: NOI from equity accounted investments |
|
(4,580) |
|
— |
Net rental income |
$ |
217,899 |
$ |
168,883 |
Appendices
Reconciliation of FFO to net income
The table below reconciles FFO for the three months and years ended December 31, 2021 and December 31, 2020 to net income.
|
Three months ended December 31, |
|
Year ended December 31, |
||||||
|
|
2021 |
|
2020 |
|
|
2021 |
|
2020 |
Net income for the period |
$ |
189,971 |
$ |
81,513 |
|
$ |
608,345 |
$ |
200,136 |
Add (deduct): |
|
|
|
|
|
|
|
|
|
Fair value adjustments to investment properties |
|
(141,841) |
|
(91,855) |
|
|
(586,011) |
|
(120,079) |
Fair value adjustments to financial instruments |
|
18,818 |
|
36,489 |
|
|
111,723 |
|
10,915 |
Share of net income from equity accounted investment |
|
(26,239) |
|
— |
|
|
(39,270) |
|
— |
Interest expense on subsidiary redeemable units |
|
3,247 |
|
3,247 |
|
|
12,986 |
|
13,051 |
Amortization and write-off of lease incentives |
|
498 |
|
436 |
|
|
1,807 |
|
1,645 |
Internal leasing costs |
|
1,022 |
|
772 |
|
|
3,683 |
|
3,067 |
Fair value adjustments to deferred trust units included in G&A |
|
155 |
|
21 |
|
|
357 |
|
(130) |
Foreign exchange gain |
|
(4,001) |
|
(469) |
|
|
(2,093) |
|
(1,582) |
Share of FFO from equity accounted investment |
|
1,502 |
|
— |
|
|
3,066 |
|
— |
Deferred income taxes expense |
|
9,232 |
|
1,781 |
|
|
12,133 |
|
8,672 |
Current income taxes expense related to dispositions |
|
273 |
|
— |
|
|
16,862 |
|
— |
Transaction costs on sale of investment properties |
|
303 |
|
— |
|
|
2,366 |
|
2 |
Derecognition of equity accounted investment |
|
(907) |
|
— |
|
|
(907) |
|
— |
FFO for the period before the undernoted adjustment |
|
52,033 |
|
31,935 |
|
|
145,047 |
|
115,697 |
Debt settlement costs |
|
— |
|
— |
|
|
31,569 |
|
3,949 |
FFO for the period |
$ |
52,033 |
$ |
31,935 |
|
$ |
176,616 |
$ |
119,646 |
Reconciliation of available liquidity to cash and cash equivalents (per consolidated financial statements)
The table below reconciles available liquidity to cash and cash equivalents as at December 31, 2021 and December 31, 2020.
|
December 31, 2021 |
December 31, 2020 |
||
Cash and cash equivalents per consolidated financial statements |
$ |
164,015 |
$ |
254,935 |
Undrawn unsecured revolving credit facility(1) |
|
347,597 |
|
318,300 |
Available liquidity |
$ |
511,612 |
$ |
573,235 |
(1) Net of a letter of credit totalling $2,403 as at December 31, 2021. |
||||
Reconciliation of total equity (including LP B Units) to total equity (per consolidated financial statements)
The table below reconciles total equity (including LP B Units) to total equity (excluding LP B Units) as at December 31, 2021 and December 31, 2020.
|
As at |
||||||
|
December 31, 2021 |
|
December 31, 2020 |
||||
(in thousands of dollars, except number of Units) |
Number of
|
|
Amount |
|
Number of
|
|
Amount |
REIT Units and unitholders’ equity |
233,864,845 |
$ |
2,756,156 |
|
152,678,861 |
$ |
1,605,724 |
Retained earnings |
— |
|
746,848 |
|
— |
|
281,531 |
Accumulated other comprehensive income (loss) |
— |
|
(3,581) |
|
— |
|
17,621 |
Total equity per consolidated financial statements |
233,864,845 |
|
3,499,423 |
|
152,678,861 |
|
1,904,876 |
Add: LP B Units |
18,551,855 |
|
319,463 |
|
18,551,855 |
|
243,957 |
Total equity (including LP B Units) |
252,416,700 |
$ |
3,818,886 |
|
171,230,716 |
$ |
2,148,833 |
View source version on businesswire.com: https://www.businesswire.com/news/home/20220215006070/en/
Dream Industrial REIT
Brian Pauls
Chief Executive Officer
(416) 365-2365
[email protected]
Lenis Quan
Chief Financial Officer
(416) 365-2353
[email protected]
Alexander Sannikov
Chief Operating Officer
(416) 365-4106
[email protected]
Please make the indicated changes including the new text: US quotes snapshot data provided by IEX. Additional price data and company information powered by Twelve Data.