
Dream Industrial REIT Reports Strong Q4 2020 Results and Addition of New Top 10 Tenant
Dream Industrial REIT (DIR.UN-TSX) or (the “Trust” or “DIR” or the “REIT” or “we”) today announced its financial results for the three months and year ended December 31, 2020. Management will host a conference call to discuss the financial results on February 17, 2021 at 11:00 a.m. (ET).
This press release features multimedia. View the full release here: https://www.businesswire.com/news/home/20210216006220/en/
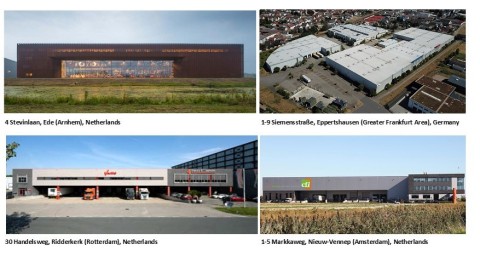
Figure 1, Q4-2020 Acquisitions (Photo: Business Wire)
HIGHLIGHTS
-
Strong organic, FFO per Unit(1) and NAV per Unit(1) growth:
- Diluted funds from operations (“FFO”) per Unit(1) was $0.19 in Q4 2020, a 3% increase when compared to Q4 2019, despite a 12% increase in total number of units;
- Comparative properties NOI (“CP NOI”) (constant currency basis)(1) increased by 2.3% and 1.5%, when compared to Q3 2020 and Q4 2019, respectively;
- Investment property fair values increased by $92 million in Q4 2020 and $120 million for the full year 2020 largely reflecting higher market rents, strong leasing activity, and declining capitalization rates across the Trust’s portfolio in Ontario, Québec, and Europe; and
- Net asset value per Unit(1) increased in Q4 2020 by 3.7% and 6.7%, when compared to Q3 2020 and Q4 2019, respectively, to $12.55.
-
Significant leasing activity across the portfolio:
- Recently, the Trust has entered into two leases with subsidiaries of Amazon Inc. (“Amazon”) for over 400,000 square feet at its properties in Louisville, Kentucky and London, Ontario. Pro forma these leases, Amazon is expected to become the Trust’s 6th largest tenant by gross leasable area and amongst the top 10 tenants by annualized gross rental revenue;
- In total, since the end of Q3 2020, the Trust has signed over 1.0 million square feet of new leases at a 20% spread to prior rents, of which approximately 615,000 square feet were signed subsequent to year end; and
- In addition, the Trust completed nearly 900,000 square feet of renewals at a 10% spread over expiring rents since the end of the third quarter.
-
Robust pace of capital deployment and continued portfolio high-grading:
- $112 million of acquisitions completed during Q4 2020 in Europe, bringing the total acquisition volume for 2020 to $623 million; and
- Additional $355 million of acquisitions closed, under contract or in exclusivity in the Trust’s target markets in Canada, the U.S., Germany, and the Netherlands. Thus far in 2021, approximately $138 million of these acquisitions have closed.
-
Strengthening the balance sheet and lowering cost of capital:
- Lowered average in-place interest rate on total debt outstanding by over 100 basis points year-over-year from 3.59% as at December 31, 2019 to 2.57% as at December 31, 2020;
- Successful issuance of nearly $450 million of unsecured debt at an average effective interest rate of 0.65%, consistent with the Trust’s European debt strategy; and
- On October 22, 2020, the Trust was assigned an Issuer Rating of BBB with Stable Trend by DBRS Limited (“DBRS”).
- ESG Update – The Trust released its 2019 Corporate Sustainability Report in December 2020 (link), which outlines the priorities and achievements of the Trust’s Sustainability Strategy.
FINANCIAL HIGHLIGHTS
SELECTED FINANCIAL INFORMATION |
|
|
|
|
|
|
|
|
|
||||
(unaudited) |
Three months ended |
|
Year ended |
||||||||||
|
|
December 31, |
|
December 31, |
|
|
December 31, |
|
December 31, |
||||
(in thousands of dollars except per Unit amounts) |
|
2020 |
|
2019 |
|
|
2020 |
|
2019 |
||||
Operating results |
|
|
|
|
|
|
|
|
|
||||
Net income |
$ |
81,513 |
$ |
106,642 |
|
$ |
200,136 |
$ |
179,432 |
||||
Funds from operations (“FFO”)(1) |
|
31,935 |
|
25,809 |
|
|
119,646 |
|
105,036 |
||||
Net rental income |
|
44,512 |
|
36,224 |
|
|
168,883 |
|
139,026 |
||||
CP NOI (constant currency basis)(1)(2) |
|
36,554 |
|
36,012 |
|
|
123,825 |
|
124,131 |
||||
Per Unit amounts |
|
|
|
|
|
|
|
|
|
||||
Distribution rate |
$ |
0.17 |
$ |
0.17 |
|
$ |
0.70 |
$ |
0.70 |
||||
FFO – diluted(1)(3) |
$ |
0.19 |
$ |
0.18 |
|
$ |
0.71 |
$ |
0.78 |
||||
Financing and Capital |
|
|
|
|
|
|
|
|
|
||||
Net total debt-to-assets ratio(1) |
|
|
|
|
|
|
|
|
|
||||
End of period |
|
31.3% |
|
23.7% |
|
|
31.3% |
|
23.7% |
||||
Beginning of period |
|
29.6% |
|
31.4% |
|
|
23.7% |
|
43.5% |
||||
Net asset value (“NAV”) per Unit (year-end)(1) |
$ |
12.55 |
$ |
11.76 |
|
|
|
|
|
||||
See footnotes at end. |
|
|
|
|
|
|
|
|
|
||||
PORTFOLIO INFORMATION |
|
|
|
|
||
(unaudited) |
|
As at |
||||
|
|
December 31, |
|
December 31, |
||
(in thousands of dollars) |
|
2020 |
|
2019 |
||
Total portfolio |
|
|
|
|
||
Number of assets(4) |
|
177 |
|
130 |
||
Investment properties fair value |
$ |
3,241,601 |
$ |
2,428,664 |
||
Gross leasable area (“GLA”) (in millions of sq. ft.) |
|
27.3 |
|
21.9 |
||
Occupancy rate – in-place and committed (year-end) |
|
95.6% |
|
95.8% |
||
Occupancy rate – in-place (year-end) |
|
94.7% |
|
94.9% |
||
See footnotes at end. |
|
|
|
|
||
FINANCING INFORMATION |
|
|
|
|
||
(unaudited) |
|
As at |
||||
|
|
December 31, |
|
December 31, |
||
(in thousands of dollars) |
|
2020 |
|
2019 |
||
DBRS credit rating |
|
BBB (mid) |
|
— |
||
Net total debt-to-assets ratio(1) |
|
31.3% |
|
23.7% |
||
Net total debt-to-adjusted EBITDAFV (years)(1) |
|
6.2 |
|
4.3 |
||
Interest coverage ratios (times)(1) |
|
4.4 |
|
3.8 |
||
Weighted average face interest rate on debt (year-end)(5) |
|
2.57% |
|
3.59% |
||
Weighted average remaining term to maturity on debt (years) |
|
4.8 |
|
5.5 |
||
Unencumbered assets (year-end)(1) |
$ |
1,441,589 |
$ |
96,251 |
||
Available liquidity (year-end)(1) |
$ |
573,235 |
$ |
591,537 |
||
See footnotes at end. |
|
|
|
|
||
“The DIR team successfully navigated through a challenging year and achieved transformational milestones across all aspects of the business,” said Brian Pauls, Chief Executive Officer of Dream Industrial REIT. “We announced our European expansion at the beginning of the year and we now have nearly $475 million, or 15% of our portfolio, located in the strong industrial markets of Germany and the Netherlands. We successfully implemented our debt strategy with nearly $450 million of euro-equivalent debt at an average rate of 0.65%. Leasing activity was strong in the last half of 2020 and the pace of rental rate growth continues in our portfolio with over 4.5 million square feet of leases signed at double-digit rental spreads since the beginning of 2020. Moreover, we advanced our development pipeline significantly and completed over $620 million of high quality acquisitions. Our initiatives have positioned us well to grow FFO per unit and continue to create long-term value for our unitholders.”
STRATEGIC HIGHLIGHTS
Acquisitions – During the quarter, the Trust completed five acquisitions in Europe totalling approximately $112 million. For the full year, the Trust completed $623 million of acquisitions, and thus far in 2021, has closed, is under contract or in exclusivity on $355 million of assets in the U.S., Germany, the Netherlands, and its target Canadian markets. These acquisitions allow the Trust to add scale in its target markets adding approximately 7.5 million square feet of high quality, well-located and functional logistics space to the Trust’s portfolio. Built on average in the late 2000s, these assets are above the average quality of the Trust’s portfolio, with an average clear ceiling height of over 30 feet and occupied by high quality tenants mainly in the logistics and consumer goods sectors. Thus far in 2021, the Trust has closed just over $138 million of assets in Québec, Germany, and the U.S., with the remainder expected to close in the next 30-60 days. Please refer to the Trust’s press release (link) dated January 20, 2021 for further details on these acquisitions.
Acquisitions closed during Q4 2020
See Figure 1, Q4-2020 Acquisitions
Capital strategy – The Trust’s strong and flexible balance sheet, along with its superior portfolio and tenant diversification, resulted in the Trust receiving an issuer rating of BBB (mid) with stable trend from DBRS during Q4 2020. The investment grade rating immediately lowers borrowing costs for the Trust and enhances access to debt capital markets. During the quarter, the Trust obtained nearly $450 million of unsecured debt at an average interest rate of approximately 0.65%, and lowered its average in-place interest rate by 100 basis points over the year to 2.57%. On January 29, 2021, the Trust closed on a $259 million equity offering, and utilized the net proceeds to pre-pay $130 million of Canadian mortgages with an average interest rate of 3.59% on February 1, 2021, increasing the Trust’s unencumbered asset pool to over $2.0 billion, or approximately 58% of investment properties fair value, after factoring in the $355 million of acquisitions that have closed, are under contract, or in exclusive negotiations.
“After significantly reducing leverage over the last three years, we have increased financial flexibility to support the continued growth and high-grading of our portfolio,” said Lenis Quan, Chief Financial Officer of Dream Industrial REIT. “Our geographic diversity provides us flexibility to allocate capital towards the most attractive opportunities across our markets, and to access capital at the most optimal cost for the REIT, allowing us to achieve attractive returns as we execute on our strategic initiatives. We continue to maintain a strong balance sheet with over $250 million of acquisition capacity to further grow our portfolio in conjunction with generating cash flow per unit and NAV per unit growth.”
The Trust also intends to establish an at-the-market equity program (the “ATM Program”) that would allow the Trust to issue REIT Units to the public from time to time at prevailing market prices, directly on the Toronto Stock Exchange or on other marketplaces to the extent permitted. The Trust intends to use the net proceeds from the ATM Program, if any, to fund acquisitions, for repayment of indebtedness, and for general trust purposes. Given the current acquisition capacity available to the Trust, the Trust does not anticipate using the ATM Program while that acquisition capacity is being deployed.
Development pipeline – The Trust continues to build and execute on a development pipeline across its target markets. Within its existing portfolio, the Trust has identified 21 sites in its portfolio with over 67 acres of excess land. The Trust estimates that this excess land could accommodate up to 1.5 million square feet of additional GLA over the medium term. The Trust also identified several properties with redevelopment potential. These properties are currently improved with approximately one million square feet of GLA on over 70 acres. The Trust estimates that over time, these sites can accommodate significant intensification with more valuable uses.
The Trust has provided some highlights on its near-term development activities below:
- The Trust is nearing completion of predevelopment work at its 24.5 acre project in North Last Vegas and expects to commence construction in mid-2021. The site should support a 460,000 square foot Class A distribution facility with an expected yield on cost of over 6%;
- Recently, the Trust closed on the previously announced acquisition of 401 Marie Curie Boulevard, a 527,000 square foot Class A distribution facility in the Greater Montréal Area. The property is situated on 38.4 acres of land with site coverage of 31%, offering the opportunity to increase the property’s footprint by approximately 221,000 square feet. The Trust expects the intensification to occur over two phases, with the first phase forecast to commence in 2021. The Trust expects to achieve a yield on construction costs of over 6.5%, which would result in meaningful accretion to its NAV per Unit(1); and
401 Marie Curie Boulevard, Greater Montréal Area - Project Rendering
See Figure 2, 401 Marie Curie Boulevard, Greater Montréal Area - Project Rendering
- In the near-term, the Trust intends to expand an existing 110,000 square foot property in the Greater Toronto Area (“GTA”), located in close proximity to Highways 404 and 407. The Trust has the opportunity to add 40,000 square feet in the next 12 months, with an expected yield on construction cost of over 8.0%.
100 East Beaver Creek, Greater Toronto Area – Project Rendering
See Figure 3, 100 East Beaver Creek, Greater Toronto Area - Project Rendering
OPERATIONAL HIGHLIGHTS
-
Robust leasing momentum at attractive rental spreads – Since the end of Q3 2020, the Trust has signed over 1.9 million square feet of new leases and renewals. These leases comprised over one million square feet of new leases that were signed at an average spread of 20% over prior rates. In addition, over this period, the Trust completed approximately 900,000 square feet of renewals at rates approximately 10% above expiring rents. Leasing highlights include:
- At the Trust’s 302,500 square feet property in Louisville, Kentucky, Amazon has agreed to occupy the entire building with rent payments commencing in Q2-2021. Pro forma this lease and other U.S. leases signed thus far in 2021, in-place and committed occupancy in the Trust’s U.S. portfolio is expected to increase by over 400 basis points to approximately 97%.
- In London, Ontario, the Trust, Amazon, and the current tenant have agreed to a lease assignment for the entire property with no change to the lease term, which currently expires in early 2028. The London property totals 114,000 square feet of GLA and sits on an approximately 13-acre site, allowing the Trust to add significant additional density over time.
- At the recently acquired 6701 Financial Drive asset in Mississauga, the Trust signed an 89,000 square foot lease for a vacancy that was anticipated at the time of acquisition. The Trust signed a 7-year lease with a national logistics tenant and achieved a 100% increase on the starting rental rate, and an additional 3.5% increase annually thereafter for the remainder of the term.
- The Trust signed two 5-year new leases in Oakville for a total of 104,000 square feet, at a 44% spread over the expiring rent along with average annual contractual rental growth of 3.5% over the respective terms. One of the leases commenced in February 2021 with the other commencing in April 2021.
- The Trust signed a renewal with a tenant occupying 47,000 square feet in Mississauga, at a 27% spread over the expiring rent along with average contractual rental growth of 3.5% over the term. The renewal is effective March 1, 2021.
-
Strong rent collections – The Trust’s portfolio has remained resilient through the pandemic related market disruption and rent collections have essentially returned to pre-pandemic levels. The Trust has collected 99% of recurring contractual gross rent during Q4 2020. In addition, the Trust has collected substantially all of the contractual gross rent for Q3 2020 and Q2 2020, after adjusting for the impact of rent deferral agreements and the Canada Emergency Commercial Rent Assistance (“CECRA”) program. In the month of January 2021, the Trust has collected 97.7% of contractual gross rent with the remainder expected to be collected in the near-term. The Trust has not entered into any rent deferral arrangements subsequent to Q2 2020. To date, the Trust has received over 90% of the $2.3 million of contractual gross rent deferred during Q2 2020.
The following table summarizes selected operational statistics with respect to the past three quarters and January 2021, all presented as a percentage of recurring contractual gross rent as at February 16, 2021:
SELECTED OPERATIONAL STATISTICS |
|
|
|
|
(unaudited) |
Q2 2020 |
Q3 2020 |
Q4 2020 |
Jan-21 |
Cash collected from tenants |
95.8% |
96.3% |
99.0% |
97.7% |
CECRA cash collected from government |
2.4% |
2.0% |
0.0% |
0.0% |
Sub-total of cash collected from tenants and government* |
98.2% |
98.3% |
99.0% |
97.7% |
Deferrals granted (with defined repayment schedule) |
3.5% |
0.0% |
0.0% |
0.0% |
Cash collected on deferrals granted |
(3.2%) |
0.0% |
0.0% |
0.0% |
Sub-total of deferrals granted (net of cash collected)* |
0.3% |
0.0% |
0.0% |
0.0% |
CECRA (the Trust's portion) |
1.2% |
1.0% |
0.0% |
0.0% |
Sub-total of cash collected, adjusted for CECRA and deferrals granted* |
99.7% |
99.3% |
99.0% |
97.7% |
Remaining to be collected |
0.3% |
0.7% |
1.0% |
2.3% |
Total* |
100.0% |
100.0% |
100.0% |
100.0% |
*includes applicable taxes |
|
|
|
|
“Our robust operating results showcase the quality of our well-located urban portfolio, which continues to attract major national and global e-commerce occupiers,” said Alexander Sannikov, Chief Operating Officer of Dream Industrial REIT. “Our leasing momentum has significantly improved the outlook for our operating results in 2021 and future years and we intend to increase our focus on strategic development and intensification initiatives that should result in meaningful NAV per unit growth over the long term. At the same time, we remain dedicated to following through on our sustainability goals outlined in our Corporate Sustainability Report.”
FINANCIAL HIGHLIGHTS
-
Net income for the quarter and year – For the three months ended December 31, 2020, the Trust recorded net income of $81.5 million consisting of net rental income of $44.5 million, fair value adjustments to investment properties of $91.9 million, partially offset by fair value losses to financial instruments of $36.5 million primarily attributed to the revaluation of subsidiary redeemable units, and cumulative other income and expenses of $18.4 million.
For the year ended December 31, 2020, the Trust recorded net income of $200.1 million, consisting of net rental income of $168.9 million, fair value adjustments to investment properties of $120.1 million, partially offset by cumulative other income and expenses of $88.9 million. - Diluted FFO per Unit(1) for the quarter and year –Diluted FFO per Unit for the three months and year ended December 31, 2020 was 19 cents and 71 cents, respectively, compared to 18 cents and 78 cents, for the respective periods in December 31, 2019. In the quarter, FFO increased despite an increase in units outstanding, as a result of CP NOI(1) growth, and income from acquisitions closed in the year. For the year ended, FFO per Unit was lower when compared to prior year primarily due to dilution from timing of deployment of the Trust’s excess liquidity earlier in the year.
- Net rental income for the quarter and year – Net rental income for the three months and year ended December 31, 2020 was $44.5 million and $168.9 million, respectively, representing an increase of $8.3 million or 23% over the prior year comparative quarter and an increase of $29.9 million or 22% over the prior year. The increase in net rental income was mainly attributed to investment properties acquired during 2020 and 2019.
-
Comparative properties NOI (constant currency basis)(1) for the quarter and year – Comparative properties NOI (constant currency basis) for the three months and year ended December 31, 2020 was an increase of 1.5% and a modest decrease of 0.2%, respectively, when compared to the prior year comparative periods.
Comparative properties NOI (constant currency basis) was positively impacted by increasing average in-place rental rates of approximately 3.8% and 2.1%, respectively, for the three months and year ended December 31, 2020. The rental rate growth was offset by the timing of lease-up of vacancy. As of the date of this press release, the Trust has signed lease commitments for over 600,000 square feet of its current vacancy. Excluding spaces vacant upon acquisition, committed rents exceeded the prior rents by over 30%. The majority of these leases are scheduled to commence in the first half of 2021. - NAV per Unit(1) – NAV per Unit as at December 31, 2020 increased by $0.45, or 3.7%, to $12.55 from $12.10 as at September 30, 2020, largely reflecting an increase in investment property values across the Trust’s portfolio as private market demand for industrial assets remains robust.
CONFERENCE CALL
Senior management will host a conference call to discuss the financial results on Wednesday, February 17, 2021 at 11:00 a.m. (ET). To access the conference call, please dial 1-888-465-5079 in Canada or 416-216-4169 elsewhere and use passcode 8684 600#. To access the conference call via webcast, please go to Dream Industrial REIT’s website at www.dreamindustrialreit.ca and click on the link for News & Events, then click on Calendar of Events. A taped replay of the conference call and the webcast will be available for ninety (90) days following the call.
Other information
Information appearing in this press release is a select summary of financial results. The consolidated financial statements and management’s discussion and analysis for the Trust will be available at www.dreamindustrialreit.ca and on www.sedar.com.
Dream Industrial REIT is an unincorporated, open-ended real estate investment trust. As at December 31, 2020, Dream Industrial REIT owns and operates a portfolio of 177 industrial assets (271 properties) comprising approximately 27.3 million square feet of gross leasable area in key markets across North America and a growing presence in strong European industrial markets. Dream Industrial REIT’s objective is to continue to grow and upgrade the quality of its portfolio and to provide attractive overall returns to its unitholders. For more information, please visit www.dreamindustrialreit.ca.
FOOTNOTES |
||
(1) |
FFO, diluted FFO per Unit, CP NOI (constant currency basis), net total debt-to-assets ratio, net total debt-to-adjusted EBITDAFV, available liquidity, NAV per Unit, interest coverage ratio and unencumbered assets are non-GAAP measures used by Management in evaluating operating and financial performance. Please refer to the cautionary statements under the heading “Non-GAAP Measures” in this press release. |
|
(2) |
CP NOI (constant currency basis) for three months ended December 31, 2020 and December 31, 2019 excludes properties acquired after October 1, 2019 and properties held for sale or disposed of prior to December 31, 2020. CP NOI (constant currency basis) for the years ended December 31, 2020 and December 31, 2019 excludes properties acquired after January 1, 2019 and properties held for sale or disposed of prior to December 31, 2020. |
|
(3) |
A description of the determination of diluted amounts per Unit can be found in the Trust’s Management’s Discussion and Analysis for the three months and year ended December 31, 2020, in the section “Non-GAAP measures and other disclosures”, under the heading “Weighted average number of Units”. |
|
(4) |
Number of assets has been restated to conform to current period presentation. An asset has been redefined to include a building or a cluster of buildings in close proximity to one another attracting similar tenants. |
|
(5) |
Weighted average face interest rate on debt is calculated as the weighted average face interest rate of all interest bearing debt. |
|
Non-GAAP Measures
The Trust’s consolidated financial statements are prepared in accordance with International Financial Reporting Standards (“IFRS”). In this press release, as a complement to results provided in accordance with IFRS, the Trust discloses and discusses certain non- GAAP financial measures, including FFO, diluted FFO per Unit, comparative properties NOI (constant currency basis), net total debt- to-assets ratio, available liquidity, NAV per Unit, net total debt-to-adjusted EBITDAFV, interest coverage ratio and unencumbered assets as well as other measures discussed elsewhere in this press release. These non-GAAP measures are not defined by IFRS, do not have a standardized meaning and may not be comparable with similar measures presented by other income trusts. The Trust has presented such non-GAAP measures as Management believes they are relevant measures of the Trust’s underlying operating and financial performance. Non-GAAP measures should not be considered as alternatives to net income, net rental income, cash flows generated from (utilized in) operating activities, cash and cash equivalents, total assets, non-current debt, total equity, or comparable metrics determined in accordance with IFRS as indicators of the Trust’s performance, liquidity, cash flow, and profitability. For a full description of these measures and, where applicable, a reconciliation to the most directly comparable measure calculated in accordance with IFRS, please refer to the “Non-GAAP measures and other disclosures” section in Dream Industrial REIT’s MD&A for the three months and year ended December 31, 2020.
Forward-looking information
This press release may contain forward-looking information within the meaning of applicable securities legislation, including statements regarding the Trust’s objectives and strategies to achieve those objectives; the Trust’s expectations relating to the benefits to be realized from demand drivers for industrial space; the Trust’s ability to accretively acquire high-quality assets while maintaining a conservatively financed balance sheet; the Trust’s ability to deliver attractive overall returns to its unitholders over the long-term; the Trust’s expected acquisitions and anticipated additional square footage resulting from such acquisitions; the effect of acquisitions on its leverage levels; the anticipated timing of closing of the acquisitions referred to in this press release; the expected going-in cap rate of the acquisitions; the Trust’s acquisition pipeline; the Trust’s FFO per Unit in future periods; the pro forma composition of the Trust’s portfolio after the completion of the acquisitions and potential development opportunities; the expectation that Amazon will be the Trust’s 6th largest tenant; the Trust’s development and redevelopment plans, including the timing of construction, timing of completion of the Trust’s developments and anticipated yields; the Trust’s ability to access debt markets more efficiently in order to continue to execute on its strategy to grow and upgrade the quality of the portfolio; expected interest rates and costs of debt; the intended use of proceeds of the term loan; expected debt and liquidity levels and unencumbered asset pool; the Trust’s intent to establish the ATM Program and the intended use of proceeds from such program and the Trust’s expectations of the extent of rent deferrals and repayment from tenants. Forward-looking information is based on a number of assumptions and is subject to a number of risks and uncertainties, many of which are beyond Dream Industrial REIT’s control, which could cause actual results to differ materially from those that are disclosed in or implied by such forward-looking information. These risks and uncertainties include, but are not limited to, general and local economic and business conditions; employment levels; mortgage and interest rates and regulations; the uncertainties around the timing and amount of future financings; uncertainties surrounding the COVID-19 pandemic and government measures related thereto; the financial condition of tenants; leasing risks, including those associated with the ability to lease vacant space; rental rates on future leasing; and interest and currency rate fluctuations. The Trust’s objectives and forward-looking statements are based on certain assumptions, including that the general economy remains stable, interest rates remain stable, conditions within the real estate market remain consistent, competition for acquisitions remains consistent with the current climate and that the capital markets continue to provide ready access to equity and/or debt. All forward-looking information in this press release speaks as of the date of this press release. Dream Industrial REIT does not undertake to update any such forward-looking information whether as a result of new information, future events or otherwise except as required by law. Additional information about these assumptions and risks and uncertainties is contained in Dream Industrial REIT’s filings with securities regulators, including its latest annual information form and MD&A. These filings are also available at Dream Industrial REIT’s website at www.dreamindustrialreit.ca.
View source version on businesswire.com: https://www.businesswire.com/news/home/20210216006220/en/
Brian Pauls
Chief Executive Officer
(416) 365-2365
[email protected]
Lenis Quan
Chief Financial Officer
(416) 365-2353
[email protected]
Alexander Sannikov
Chief Operating Officer
(416) 365-4106
[email protected]
Please make the indicated changes including the new text: US quotes snapshot data provided by IEX. Additional price data and company information powered by Twelve Data.