
Dream Industrial REIT Reports Strong Q3 2021 Financial Results
Dream Industrial REIT (DIR.UN-TSX) or (the “Trust” or “DIR” or the “REIT” or “we”) today announced its financial results for the three and nine months ended September 30, 2021. Management will host a conference call to discuss the financial results on November 3, 2021, at 11:00 a.m. (ET).
This press release features multimedia. View the full release here: https://www.businesswire.com/news/home/20211102006386/en/
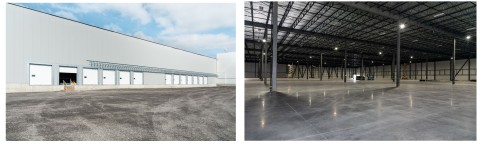
401 Marie Curie Phase 1 Expansion Source: Laurie-Anne Roux Photographe
HIGHLIGHTS
-
Strong diluted FFO per Unit(1) and NAV per Unit(1) growth:
- Diluted funds from operations (“FFO”) per Unit(1) was $0.22 in Q3 2021, a 25% increase when compared to Q3 2020;
- Net asset value (“NAV”) per Unit(1) was $14.37 in Q3 2021, an increase of 18.8%, compared to $12.10 in Q3 2020;
- Investment property values increased quarter-over-quarter due to $162.5 million in fair value gains recognized in Q3 2021, reflecting higher market rents, strong leasing activity in Ontario, and compression in capitalization rates mainly in Québec;
- Net rental income in Q3 2021 was $60 million, an increase of 41.3% compared to $42 million in Q3 2020; and
- Comparative properties net operating income (“CP NOI”) (constant currency basis)(1) in Q3 2021 increased by 7.5%, when compared to Q3 2020. The Canadian portfolio posted a 7.8% CP NOI growth, predominantly driven by 15.2% and 4.9% CP NOI increases in Ontario and Québec, respectively.
-
Continued portfolio high-grading and increased financial flexibility:
- Over $1.9 billion of acquisitions completed to date in 2021, as well as $0.6 billion of acquisitions that are firm, under contract, or in exclusive negotiations, and are expected to close in the next 60 to 90 days;
- Executing on development pipeline – Phase 1 of the Trust’s 220,000 square foot expansion in Montréal is largely complete with Phase 2 underway. The Trust expects to commence construction of approximately 1.3 million square feet in 2022; and
- Enhanced balance sheet flexibility – During the quarter, the Trust repaid approximately $263.7 million of Canadian mortgages at an average interest rate of 3.54%, lowering the proportion of secured debt(1) to 31.9% of total debt outstanding, and increasing its unencumbered asset(1) pool to over $3.4 billion, representing approximately 67.4% of investment properties value as at September 30, 2021.
-
Maximizing rental rate growth across the portfolio with solid leasing momentum:
- Since the end of Q2 2021, the Trust has signed approximately 1.0 million square feet of new and renewed leases at a 23% spread over prior rents; and
- Strong leasing momentum resulted in a 290 basis points increase in in-place and committed occupancy from 95.1% as at September 30, 2020, to 98.0% as at September 30, 2021.
FINANCIAL HIGHLIGHTS
SELECTED FINANCIAL INFORMATION |
|||||||||||||||
(unaudited) |
Three months ended |
|
|
|
Nine months ended |
||||||||||
|
|
September 30, |
|
|
|
September 30, |
|
|
|
September 30, |
|
|
|
September 30, |
|
(in thousands of dollars except per Unit amounts) |
|
2021 |
|
|
|
2020 |
|
|
|
2021 |
|
|
|
2020 |
|
Operating results |
|
|
|
|
|
|
|
|
|||||||
Net income |
$ |
162,815 |
$ |
73,662 |
$ |
418,374 |
$ |
118,623 |
|||||||
Funds from operations (“FFO”)(1) |
|
50,517 |
|
30,159 |
|
124,583 |
|
87,711 |
|||||||
Net rental income |
|
59,710 |
|
42,252 |
|
157,467 |
|
124,371 |
|||||||
CP NOI (constant currency basis)(1)(2) |
|
38,437 |
|
35,750 |
|
105,640 |
|
100,933 |
|||||||
Per Unit amounts |
|
|
|
|
|
|
|
|
|||||||
Distribution rate |
$ |
0.17 |
$ |
0.17 |
$ |
0.52 |
$ |
0.52 |
|||||||
FFO – diluted(1)(3) |
$ |
0.22 |
$ |
0.18 |
$ |
0.60 |
$ |
0.52 |
|||||||
See footnotes at end. |
|||||||||||||||
PORTFOLIO INFORMATION |
|
||||||||||
(unaudited) |
As at |
||||||||||
|
September 30, |
December 31, |
September 30, |
||||||||
(in thousands of dollars) |
|
2021 |
|
2020 |
|
2020 |
|||||
Total portfolio |
|
|
|
|
|
|
|||||
Number of assets(4)(5)(6) |
|
221 |
|
177 |
|
172 |
|||||
Investment properties fair value(7) |
$ |
5,048,986 |
$ |
3,241,601 |
$ |
3,051,597 |
|||||
Gross leasable area (“GLA”) (in millions of sq. ft.)(5) |
|
39.8 |
|
27.3 |
|
26.6 |
|||||
Occupancy rate – in-place and committed (period-end)(8) |
|
98.0% |
|
95.6% |
|
95.1% |
|||||
Occupancy rate – in-place (period-end)(8) |
|
97.6% |
|
94.7% |
|
94.1% |
|||||
See footnotes at end. |
|||||||||||
FINANCING AND CAPITAL INFORMATION |
|
||||||||||
(unaudited) |
As at |
||||||||||
|
September 30, |
|
|
December 31, |
|
|
|
September 30, |
|||
(in thousands of dollars) |
|
2021 |
|
|
|
2020 |
|
|
|
2020 |
|
Credit rating – DBRS |
|
BBB (mid) |
|
BBB (mid) |
|
– |
|||||
Net total debt-to-assets ratio(1) |
|
32.9 % |
|
31.3% |
|
29.6% |
|||||
Net total debt-to-adjusted EBITDAFV (years)(1) |
|
7.8 |
|
6.2 |
|
5.8 |
|||||
Interest coverage ratio (times)(1) |
|
6.3 |
|
4.4 |
|
4.2 |
|||||
Weighted average face interest rate on debt (period-end) |
|
0.86 % |
|
2.57% |
|
3.43% |
|||||
Weighted average term to maturity on debt (years) |
|
3.9 |
|
4.8 |
|
5.1 |
|||||
Unencumbered assets (period-end)(1)(9) |
$ |
3,404,157 |
$ |
1,441,589 |
$ |
1,283,409 |
|||||
Available liquidity (period-end)(1) |
|
434,809 |
|
573,235 |
|
271,634 |
|||||
NAV per Unit (period-end)(1) |
|
14.37 |
|
12.55 |
|
12.10 |
|||||
“We continue to make significant progress across all aspects of the business,” said Brian Pauls, Chief Executive Officer of Dream Industrial REIT. “Our pace of capital deployment has been strong, and we have more than doubled the size of our portfolio since announcing our European expansion at the beginning of 2020. At the same time, we have reported strong operating results and grown FFO and NAV per unit significantly. We maintain one of the strongest and most flexible balance sheets in the Canadian REIT sector, which provides us ample capacity to grow through high-quality acquisitions with significant room to expand our development program. We look forward to continuing to execute on our focused strategy of adding scale in high-quality markets and maximizing rental rate growth across our existing portfolio, while generating significant long-term value for our unitholders.”
STRATEGIC HIGHLIGHTS
Acquisitions – Since the end of Q2 2021, the Trust has closed on eight high-quality logistics assets across Canada, and Europe totalling $220 million, representing a weighted average capitalization rate (“cap rate”) of 4.7%. These acquisitions have added over 1.4 million square feet of high quality, well-located and functional logistics space to the Trust’s portfolio. Built on average in the mid-2000s, these assets are above the average quality of the Trust’s portfolio, and have an average clear ceiling height of over 30 feet.
The pipeline for future acquisitions remains robust and the Trust has waived conditions on approximately $226 million of assets in Canada and Germany totalling 1.1 million square feet, and has an additional six deals totalling 2.5 million square feet in exclusive negotiations for a total purchase price of $383 million, that are expected to close in the next 60 to 90 days. Pro forma these acquisitions, the Trust will have acquired over $2.5 billion of assets in 2021, which represents an increase of nearly 80% over the Trust’s investment properties value at the beginning of the year.
For further details on these acquisitions, please refer to the Trust’s press release (link) dated October 13, 2021.
Recently, the Trust waived conditions on an approximately 149,000 square foot urban logistics building in the Greater Toronto Area (“GTA”). The building is occupied by two tenants with a relatively short weighted average lease term of only 1.5 years with market rents over 25% higher than expiring rents. The asset is situated on a 6.8-acre site in an established industrial node in the GTA East sub-market, just south of Highway 401.
U.S. industrial venture – On July 30, 2021, the Trust sold 18 of its U.S. assets (29 buildings in total) to a private open-ended U.S. industrial fund (the “U.S. Fund”) in consideration for net proceeds of approximately $215 million (net of estimated cash taxes payable) and a 24.5% retained interest in the U.S. Fund. A subsidiary of the Trust will provide property management, construction management and leasing services to the U.S. Fund at market rates. The remaining three U.S. properties including the Trust’s 80% stake in the Las Vegas development are expected to be sold to the Fund in Q4 2021. The creation of the U.S. Fund is expected to provide a growing income stream to the Trust as the U.S. Fund scales in attractive U.S. industrial markets. This transaction allows the Trust to continue to grow in attractive U.S. industrial markets, improving overall portfolio quality and diversification, while maintaining an enhanced geographic mix.
Development pipeline – The Trust has initiated a structured development program that allows it to add high-quality assets to its portfolio in markets with steep barriers to entry. Below is a summary of the key updates on the Trust’s development pipeline:
- The first phase of the expansion at 401 Marie Curie in the Greater Montréal Area is well underway with construction expected to be completed in early 2022. As part of the first phase, the Trust will add 132,000 square feet of warehouse space with a clear ceiling height of 32 feet. The 90,000 square foot Phase 2 expansion is underway and is expected to be completed in the next 12 months. Overall, the Trust expects to add 220,000 square feet of additional GLA at the property, and achieve an unlevered yield above 6.5%;
See Figure 1, 401 Marie Curie Phase 1 expansion
- The Trust expects to commence the expansion of an additional 280,000 square feet of GLA in the GTA and Dresden, Germany within the next 60 to 90 days;
See Figure 2, 3 100 East Beaver Creek, GTA expansion (left) and Dresden, Germany expansion (right) – Project Rendering
- The Trust continues to make significant progress on its redevelopment pipeline and expects to commence construction on its inaugural redevelopment project in the GTA in mid-2022. The Trust intends to build a 210,000 square foot building with a forecasted yield on cost that is at least 150 basis points higher than core stabilized product in the sub-market;
See Figure 4, Redevelopment project in the GTA – Project Rendering
- The Trust is in advanced stages of obtaining the site plan approval for the construction of approximately 150,000 square feet of modern last mile logistics space on its recently acquired site located on Abbotside Drive in the GTA. The Trust intends to commence construction in Q1 2022.
See Figure 5, Abbotside Drive, GTA – Project Rendering
“Our high-quality urban portfolio continues to increase in value, driven by higher market rents and declining cap rates due to the strong outlook for further rental rate growth. The secular tailwinds supporting industrial fundamentals continue to underscore the advantages of owning a portfolio in markets with steep barriers to entry,” said Alexander Sannikov, Chief Operating Officer of Dream Industrial REIT. “Our pace of organic growth continues to accelerate as we look forward to enhancing returns further with a structured development program. We currently have a pipeline of projects in excess of three million square feet. We expect these projects to create significant value and cash flow growth over time.”
Capital strategy – The Trust continues to focus on growing and upgrading portfolio quality while increasing financial flexibility. During the quarter, the Trust repaid approximately $263.7 million of Canadian mortgages bearing interest at an average rate of 3.54%. The Trust’s debt strategy has allowed it to reduce its average interest rate on its total debt outstanding by approximately 250 basis points or nearly 70% year-over-year, from over 3.4% to approximately 1% over this time period. In addition, the Trust has successfully transitioned its debt stack to be largely unsecured, with the proportion of secured debt(1) dropping to less than 11% of total assets and approximately 32% of total debt, compared to 100% a year ago.
Since Q2 2021, the Trust has utilized its at-the-market program (“ATM Program”) to raise approximately $31.8 million over the course of the quarter, at an average unit price of $16.81. Subsequent to quarter-end, the Trust raised a further $9.2 million through the ATM Program at an average unit price of $16.29, and completed a $287.7 million bought deal equity offering, issuing 17.4 million units at an offering price of $16.50 per REIT Unit. The net proceeds from the equity offering as well as the ATM Program will be utilized to fund the Trust’s acquisition pipeline and for general Trust purposes.
“We continue to execute on our strategy to grow and upgrade portfolio quality while maintaining a strong and flexible balance sheet,” said Lenis Quan, Chief Financial Officer of Dream Industrial REIT. “Our business continues to increase in value with our NAV per unit increasing for a 5th consecutive quarter, driven by continued demand for industrial space from both occupiers and investors. Our pool of investment opportunities is deep and with access to lower cost long-term debt at rates less than 1%, ample acquisition capacity, and strong organic growth we expect cash flow per unit and NAV per unit growth to accelerate.”
OPERATIONAL HIGHLIGHTS
-
Robust leasing momentum at attractive rental spreads – Strong demand from high-quality occupiers continues to result in significant rental rate growth across the Trust’s portfolio. Since the end of Q2 2021, the Trust has signed approximately 1.0 million square feet of new leases and renewals at an average spread of approximately 23% over prior rates.
Leasing highlights since reporting Q2 2021 results include:- The Trust signed approximately 50,000 square feet of leases in the GTA West sub-market where it doubled the rent along with achieving 3.5–4.0% annual contractual rental rate growth on the new leases;
- In Cambridge, Ontario, the Trust signed a renewal for a 51,000 square foot space at a recently acquired property, while increasing the rent by almost 80%;
- In Europe, the Trust signed a renewal for a 115,000 square foot space at a recently acquired property in Germany, achieving a rent increase of 18% compared to the prior level; and
- In the GTA East sub-market, the Trust signed a renewal for a 55,000 square foot space at a 63% spread to the prior rent, along with 4.5% annual contractual rent growth on the new lease; the Trust also leased a 78,000 square foot single-tenant building shortly after the completion of the due diligence period during the acquisition process. The Trust negotiated a ten-year lease term with 3.5% annual contractual rent growth over the term of the lease, resulting in an initial yield of 4.7%.
- Solid pace of CP NOI growth - CP NOI (constant currency basis) increased 7.5% for the three months ended September 30, 2021, compared to the prior year comparative quarter. The increase in CP NOI (constant currency basis) was primarily driven by increasing rental spreads on new and renewed leases in Ontario where the average in-place base rent increased by 9.3% during Q3 2021 relative to the prior year comparative quarter, which along with a 260 basis points increase in average occupancy drove a 15.2% year-over-year increase in CP NOI for the quarter. In Québec, a 3.6% increase in in-place base rent drove year-over-year CP NOI growth of 4.9%.
- Increased focus on sustainability initiatives – The Trust continues to execute on its 2021 ESG Plan and has made significant progress on its initiatives. The Trust is targeting to install over 50,000 solar panels across 3.5 million square feet, representing over 10% of its total portfolio. In Canada, the Trust is looking to install up to 6,300 roof-top solar panels on several buildings in its portfolio. In addition, the Trust is evaluating the installation of up to 32,000 solar panels in the Netherlands, pursuant to the subsidy that was granted by the Dutch government in 2020. The Trust has also established a target to upgrade one million square feet of LED upgrades in 2021. Thus far in 2021, the Trust has upgraded over 700,000 square feet.
The Trust continues to intensify focus on sustainability in its capital allocation decisions. The Trust issued a $400 million Green Bond in the prior quarter, and has fully deployed or committed the proceeds towards green-certified buildings or sustainable capital expenditures with the Trust’s existing portfolio.
The Trust participated in the GRESB Public Disclosure Survey in the quarter, and further to the submission, the Trust’s rank (out of 10 industry peers) in North America improved from 7th in 2020 to 2nd in 2021. In addition, the Trust received a “B” for its annual GRESB Public Disclosure Level in 2021, which compares favourably to the average score of "C" for all companies rated by GRESB globally.
On November 1, 2021, the Trust, along with Dream Unlimited Corp., Dream Office REIT, and Dream Impact Trust (collectively, “the Dream Group of Companies”), announced their formal participation in the Net Zero Asset Managers (“NZAM”) initiative. As part of the initiative, the Dream Group of Companies are committed to achieving net zero greenhouse gas (GHG) emissions by 2050 or sooner, in line with global efforts to limit warming to 1.5 degrees Celsius.
FINANCIAL HIGHLIGHTS
-
Net income for the quarter and year-to-date – For the three months ended September 30, 2021, the Trust recorded net income of $163 million consisting of net rental income of $60 million, fair value adjustments to investment properties of $162 million, partially offset by fair value adjustments to financial instruments of $16 million, debt settlement costs of $29 million and cumulative other income and expenses of $14 million.
For the nine months ended September 30, 2021, the Trust recorded net income of $418 million consisting of net rental income of $157 million, fair value adjustments to investment properties of $444 million, partially offset by fair value adjustment to financial instruments of $93 million, debt settlement costs of $32 million and cumulative other income and expenses of $58 million.
- Diluted FFO per Unit(1) for the quarter and year-to-date – Diluted FFO per Unit for the three and nine months ended September 30, 2021, was $0.22 and $0.60, respectively, compared to $0.18 and $0.52 for the three and nine months ended September 30, 2020. Diluted FFO per Unit increased as a result of strong CP NOI (constant currency basis)(1) growth, lease termination income during the quarter and income from acquisitions closed during 2020 and year-to-date 2021, and overall lower borrowing costs.
- Net rental income for the quarter and year-to-date – Net rental income for the three and nine months ended September 30, 2021, was $60 million and $157 million, respectively, representing an increase of $17 million or 41.3% and $33 million or 26.6% relative to the prior year comparative periods. The increase in net rental income was mainly attributed to strong CP NOI (constant currency basis)(1) growth and investment properties acquired during 2020 and year-to-date 2021.
- NAV per Unit(1) – NAV per Unit as at September 30, 2021, increased by $1.82, or 14.5%, to $14.37 from $12.55 as at December 31, 2020, largely reflecting an increase in investment property values across the Trust’s portfolio as private market demand for industrial assets remains robust.
CONFERENCE CALL
Senior management will host a conference call to discuss the financial results on Wednesday, November 3, 2021, at 11:00 a.m. (ET). To access the conference call, please dial 1-888-465-5079 in Canada or 416-216-4169 elsewhere and use passcode 7492 345#. To access the conference call via webcast, please go to Dream Industrial REIT’s website at www.dreamindustrialreit.ca and click on the link for News, then click on Events. A taped replay of the conference call and the webcast will be available for ninety (90) days following the call.
Other information
Information appearing in this press release is a select summary of financial results. The condensed consolidated financial statements and management’s discussion and analysis for the Trust will be available at www.dreamindustrialreit.ca and on www.sedar.com.
Dream Industrial REIT is an unincorporated, open-ended real estate investment trust. As at September 30, 2021, Dream Industrial REIT owns, manages and operates a portfolio of 221 industrial assets (326 buildings) comprising approximately 39.8 million square feet of gross leasable area in key markets across Canada, Europe, and the U.S. Dream Industrial REIT’s objective is to continue to grow and upgrade the quality of its portfolio which primarily consists of distribution and urban logistics properties and to provide attractive overall returns to its unitholders. For more information, please visit www.dreamindustrialreit.ca.
FOOTNOTES |
||
(1) |
FFO, diluted FFO per Unit, CP NOI (constant currency basis), diluted FFO per Unit, net total debt-to-assets ratio, net total debt-to-adjusted EBITDAFV, interest coverage ratio, secured debt as a percentage of total debt, secured debt as a percentage of total assets, unencumbered assets as a percentage of investment properties, available liquidity and NAV per Unit are non-GAAP measures used by Management in evaluating operating and financial performance. Please refer to the cautionary statements under the heading “Non-GAAP Measures” in this press release. |
|
(2) |
CP NOI (constant currency basis) for the three months ended September 30, 2021, and September 30, 2020, excludes properties acquired after July 1, 2020, and properties held for sale or disposed of prior to the current quarter. CP NOI (constant currency basis) for the nine months ended September 30, 2021, and September 30, 2020, excludes properties acquired after January 1, 2020, and properties held for sale or disposed of prior to the current quarter. |
|
(3) |
A description of the determination of diluted amounts per Unit can be found in the Trust’s Management’s Discussion and Analysis for the three and nine months ended September 30, 2021, in the section “Non-GAAP measures and other disclosures”, under the heading “Weighted average number of Units”. |
|
(4) |
The term “Number of properties” in prior period has been renamed to “Number of assets” and redefined as a building, or a cluster of buildings in close proximity to one another attracting similar tenants. Accordingly, the number of assets in prior periods has been revised to reflect the change in definition. |
|
(5) |
Includes the Trust’s owned and managed properties as at September 30, 2021. |
|
(6) |
Excludes assets sold and held for sale as at September 30, 2021, with the exception of the two U.S. assets held for sale to the U.S. Fund. |
|
(7) |
Excludes assets sold and held for sale as at September 30, 2021. |
|
(8) |
Includes our share of equity accounted investments as at September 30, 2021. |
|
(9) |
Unencumbered assets (non-GAAP measure) exclude assets held for sale in the current period. |
|
Non-GAAP Measures
The Trust’s condensed consolidated financial statements are prepared in accordance with International Financial Reporting Standards (“IFRS”). In this press release, as a complement to results provided in accordance with IFRS, the Trust discloses and discusses certain non- GAAP financial measures, including FFO, diluted FFO per Unit, CP NOI (constant currency basis), diluted FFO per Unit, net total debt-to-assets ratio, net total debt-to-adjusted EBITDAFV, interest coverage ratio, secured debt as a percentage of total debt, secured debt as a percentage of total assets, unencumbered assets as a percentage of investment properties, available liquidity and NAV per Unit as well as other measures discussed elsewhere in this press release. These non-GAAP measures are not defined by IFRS, do not have a standardized meaning and may not be comparable with similar measures presented by other income trusts. The Trust has presented such non-GAAP measures as Management believes they are relevant measures of the Trust’s underlying operating and financial performance. Non-GAAP measures should not be considered as alternatives to net income, net rental income, cash flows generated from (utilized in) operating activities, cash and cash equivalents, total assets, non-current debt, total equity, or comparable metrics determined in accordance with IFRS as indicators of the Trust’s performance, liquidity, cash flow, and profitability. For a full description of these measures and, where applicable, a reconciliation to the most directly comparable measure calculated in accordance with IFRS, please refer to the “Non-GAAP measures and other disclosures” section in Dream Industrial REIT’s MD&A for the three and nine months ended September 30, 2021.
Forward looking information
This press release may contain forward-looking information within the meaning of applicable securities legislation, including statements regarding the Trust’s objectives and strategies to achieve those objectives; the Trust’s ability to acquire high-quality assets; the Trust’s ability to deliver attractive overall returns to its unitholders over the long-term; the Trust’s total acquisitions in 2021; the anticipated timing of closing of the acquisitions referred to in this press release; the expected going-in cap rate of the acquisitions; the Trust’s acquisition pipeline; expectations regarding cash flow per unit and NAV per unit growth; the pro forma composition of the Trust’s portfolio after the completion of the acquisitions and potential development opportunities; the Trust’s development, expansion and redevelopment plans, including the timing of construction and expansion, expectations regarding stabilization of expansions, timing of completion of the Trust’s developments and anticipated yields; the installation of solar panels by the Trust; expected interest rates and costs of debt; expected debt and liquidity levels and unencumbered asset pool. Forward-looking information is based on a number of assumptions and is subject to a number of risks and uncertainties, many of which are beyond Dream Industrial REIT’s control, which could cause actual results to differ materially from those that are disclosed in or implied by such forward-looking information. These risks and uncertainties include, but are not limited to, general and local economic and business conditions; employment levels; mortgage and interest rates and regulations; the uncertainties around the timing and amount of future financings; uncertainties surrounding the COVID-19 pandemic; the financial condition of tenants; leasing risks, including those associated with the ability to lease vacant space; rental rates on future leasing; and interest and currency rate fluctuations. The Trust’s objectives and forward-looking statements are based on certain assumptions, including that the general economy remains stable, interest rates remain stable, conditions within the real estate market remain consistent, competition for acquisitions remains consistent with the current climate and that the capital markets continue to provide ready access to equity and/or debt. All forward-looking information in this press release speaks as of the date of this press release. Dream Industrial REIT does not undertake to update any such forward-looking information whether as a result of new information, future events or otherwise except as required by law. Additional information about these assumptions and risks and uncertainties is contained in Dream Industrial REIT’s filings with securities regulators, including its latest annual information form and MD&A. These filings are also available at Dream Industrial REIT’s website at www.dreamindustrialreit.ca.
View source version on businesswire.com: https://www.businesswire.com/news/home/20211102006386/en/
For further information, please contact:
Dream Industrial REIT
Brian Pauls
Chief Executive Officer
(416) 365-2365
[email protected]
Lenis Quan
Chief Financial Officer
(416) 365-2353
[email protected]
Alexander Sannikov
Chief Operating Officer
(416) 365-4106
[email protected]
Please make the indicated changes including the new text: US quotes snapshot data provided by IEX. Additional price data and company information powered by Twelve Data.