
Watching this week if the INK CIN Index can retake 1030
Technical Overview by Nicholas Winton, Hedgehog Trader and @HedgehogTrader on Twitter
Thank you for joining us for our technical look at the mid-cap oriented INK Canadian Insider (CIN) Index. Since our last update in which we highlighted several bullish characteristics of its chart, the index bounced from the bottom of its consolidation pattern and rose 2% before pausing on Friday.
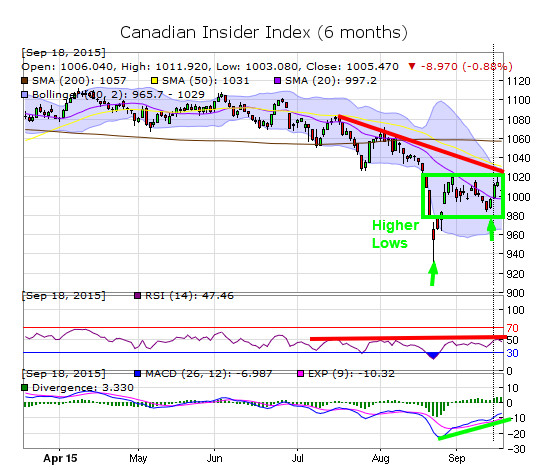
There was good reason for a pause at the end of the week, one which featured great volatility but no interest rate hike for there was natural resistance at the 1020 level which marks the top of the box-shaped pattern or trading range it's been trapped in. Secondly, the Index's downtrend line which goes back as far as June and July falls right at the 1020 level.
With its move up last week, the INK CIN Index has bullishly made higher lows over the past few weeks. Its new support is just above the 1000 level, its 20-day moving average. What's interesting is we could have the start of what looks like a much bigger rally if the INK CIN Index can push through the 1020 and 1030 levels. 1030 is an important resistance level as it is the Index's 50-day moving average. Indeed, above 1030, there remains very little resistance until the major resistance at its 200-day moving average or 1060 level, some 4% higher than where it sits now.
Elsewhere, the chart's MACD indicator remains in an uptrend, continuing to build on the positive divergence we noted last week. With the Index now at a crossroads, what it needs to free itself from its box-shaped consolidation and to carve out a major advance is for its Relative Strength Indicator (RSI) to finally turn on the jets and surge above the 50 RSI level which has capped its rallies the last few months.
jordan Sneakers | Nike nike air max paris 1 patch 2017 , Sneakers , Ietp STORE
Category:
- Please sign in or create an account to leave comments
Disclaimer :: Use of this site is subject to, and your continued use
constitutes your express agreement to be bound by, our Legal and Terms of Use. Any commercial use of this site is
strictly prohibited. Canadianinsider.com is operated by INK Research Corp (INK). INK provides general information.
INK has made all reasonable efforts to ensure that all information provided is accurate at the time of inclusion;
however, there may be errors. INK makes no guarantee of accuracy or completeness. All information and opinion
expressed herein is subject to change without notice. Read more...Insider information is based on filings made on the System
for Electronic Disclosure for Insiders (SEDI®). Data is provided “as is” and by using this site
you acknowledge that the information which comprises the data is filed by or on behalf of the SEDI filers or other
parties legally required or permitted to do so. Filings may at any time contain errors and by using this site you
acknowledge this fact. INK is not an investment advisory service, a financial planner, an investment advisor nor a
securities advisor. INK does not purport to tell people, or suggest to people, what they should buy or sell for
themselves. Opinions and recommendations contained herein should not be construed as investment advice. Do not
assume that any recommendations, insights, charts, theories, or philosophies will ensure profitable investment.
Users should always consult with and obtain advice from their professional licensed financial advisor, including
their tax advisor, to determine the suitability of any investment. INK recommends that anyone making an investment
or trading securities do so with caution. Users should perform full due diligence and investigate any security
fully before making an investment or before the execution of a security trade based upon information learned
through INK. Investors should obtain annual reports and other company information to complete their own due
diligence in any investment. Neither INK nor anyone affiliated with INK is responsible for any investment decision
made. INK employees may have an ownership or investment interest in any stock mentioned in this service or on this
website. On this site, there may be third party content, content from authors or links to third-party sites or
pages, the contents of which are not verified, maintained, controlled or supervised by INK. INK is not responsible
for and assumes no liability for the accuracy, completeness or timeliness of any third party content or authored
content provided herein or the information or contents of any linked sites or pages. The inclusion of any authored
content or link by us does not imply that INK recommends, approves or endorses the authored content or linked site
or pages. INK Edge® and INK Research® are registered trade-marks owned by INK Research Corp. SEDI®
is a registered trade-mark owned by the Alberta Securities Commission.Read less
Please make the indicated changes including the new text: US quotes snapshot data provided by IEX. Additional price data and company information powered by Twelve Data.
Interactive technical study charts by TradingView. Copyright © 2024 INK Research Corp. All rights reserved. All trade-marks or trade names not owned by INK Research Corp. are the property of their respective owners.