
Oversold INK Canadian Insider Index: Ready to bounce back?
Thank you for joining us in a weekly technical look at the mid-cap oriented INK Canadian Insider (CIN) Index. Following a heavy 27.74 point or 2.3% drop two weeks ago, the Index stemmed much of its negative momentum and lost 'just' 1.3 points when it closed on Friday at 1180.52.
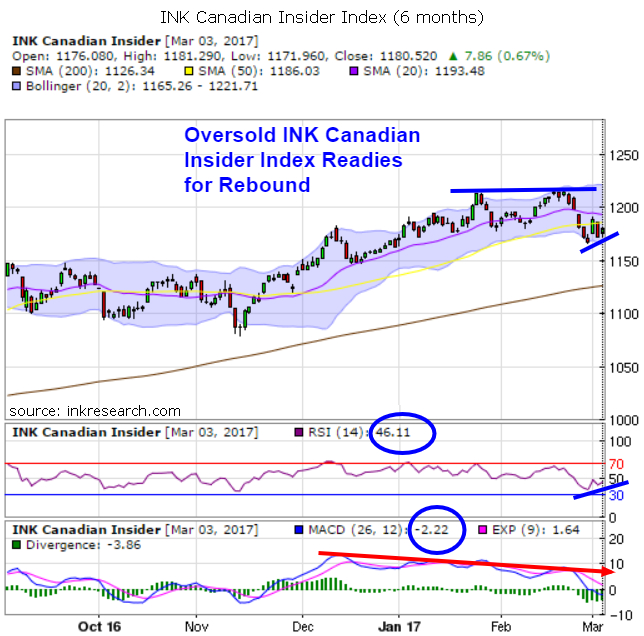
The Index's short-term momentum indicator (RSI) rose 4 points or about 10% to 46.11. MACD, which has been negatively diverging with RSI for some months, finally cracked and fell with a thud, plunging 7 points to -2.22. Notably, this is the first time since November that MACD has traded in the negative.
Resistance is currently in the 1186-1193 area (which includes both the 20 and 50 day moving averages) and, above that, 1200. Support is at 1150 and 1165.
There is potential for the oversold Index to rebound in the short-term, although it's a mixed signal. On the one hand, the near-term momentum indicator RSI is weak and sits under 50, but it has increased over the past week. If the Index can put together a couple more days above recent lows, a rally from these low levels may be in the cards.
Category:
- Please sign in or create an account to leave comments
Please make the indicated changes including the new text: US quotes snapshot data provided by IEX. Additional price data and company information powered by Twelve Data.