
INK CIN Index Teases, Resumes Consolidation
Technical Overview by Nicholas Winton, Hedgehog Trader and @HedgehogTrader on Twitter
Thank you for joining us for our weekly technical look at the mid-cap oriented INK Canadian Insider (CIN) Index.
In our last update, we observed the Canadian Insider (CIN) Index had closed above its 1020 resistance for the first time in about 2 months, a bullish achievement or so we surmised. However, success was short-lived and the Index closed above its breakout level for but a single day before retreating.
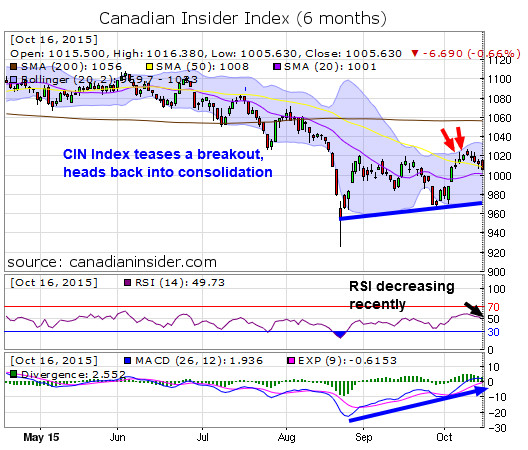
Prior to its close above 1020 and also soon afterwards, we can also see the Index bounded up against its top Bollinger band (atop the billowy, blue-infilled area we've highlighted by two red arrows) - which rejected it and sent the Index back down. So, the upper Bollinger band appears to be an additional level of resistance for the Index.
While MACD remains pointed upward and bullish, what's worked against a breakout in the Index is a weakening of momentum. That's because its RSI has now dropped from above 60, back down under the key 50 level which has capped its advance for many weeks.
At present, first overhead resistance is at 1020, and second resistance resides at 1035 where the upper Bollinger band now rests on the chart. Support remains at 1000, and 1050 (its 200-day moving average) while key support is at 970.
After a brief tease, the Index has resumed its already lengthy consolidation.
Category:
- Please sign in or create an account to leave comments
Please make the indicated changes including the new text: US quotes snapshot data provided by IEX. Additional price data and company information powered by Twelve Data.