
INK CIN Index sees major support at 990 and major resistance at 1060
Technical Overview by Nicholas Winton, @HedgehogTrader on Twitter
Thank you for joining us in this new weekly feature where we take a technical look at the INK Canadian Insider Index. In August, the index suffered a quick and sharp sell-off before rebounding and paring its losses. Following its partial recovery, the Canadian Insider Index has been trading in a very narrow range as investors await a decision from the Federal Reserve on an interest rate increase.
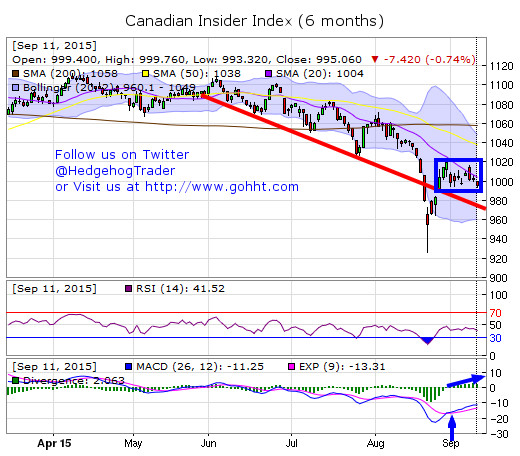
The Index is literally boxed in by major support at 990 and immediate resistance at 1020. Its downtrend line (shown in red) offers more important support just under 980. Major resistance arrives at its 200 day moving average, currently around 1060. If you're looking for risk/reward, the index provides about 20 points of downside and 60 points of upside.
Bullish or bearish? You may be surprised to learn that despite its downward slope, its chart enjoys a couple of bullish aspects. First, we can see its MACD signal triggered a short-term buy signal in early September (where the blue line crosses over the red). Secondly, there's positive divergence as we can see the histogram (green bars just above those lines) switched over from negative to positive, climbing higher even as the price of the index has remained at a standstill. A divergence frequently foreshadows a trend or momentum change, so it's well worth watching.
Category:
- Please sign in or create an account to leave comments
Disclaimer :: Use of this site is subject to, and your continued use
constitutes your express agreement to be bound by, our Legal and Terms of Use. Any commercial use of this site is
strictly prohibited. Canadianinsider.com is operated by INK Research Corp (INK). INK provides general information.
INK has made all reasonable efforts to ensure that all information provided is accurate at the time of inclusion;
however, there may be errors. INK makes no guarantee of accuracy or completeness. All information and opinion
expressed herein is subject to change without notice. Read more...Insider information is based on filings made on the System
for Electronic Disclosure for Insiders (SEDI®). Data is provided “as is” and by using this site
you acknowledge that the information which comprises the data is filed by or on behalf of the SEDI filers or other
parties legally required or permitted to do so. Filings may at any time contain errors and by using this site you
acknowledge this fact. INK is not an investment advisory service, a financial planner, an investment advisor nor a
securities advisor. INK does not purport to tell people, or suggest to people, what they should buy or sell for
themselves. Opinions and recommendations contained herein should not be construed as investment advice. Do not
assume that any recommendations, insights, charts, theories, or philosophies will ensure profitable investment.
Users should always consult with and obtain advice from their professional licensed financial advisor, including
their tax advisor, to determine the suitability of any investment. INK recommends that anyone making an investment
or trading securities do so with caution. Users should perform full due diligence and investigate any security
fully before making an investment or before the execution of a security trade based upon information learned
through INK. Investors should obtain annual reports and other company information to complete their own due
diligence in any investment. Neither INK nor anyone affiliated with INK is responsible for any investment decision
made. INK employees may have an ownership or investment interest in any stock mentioned in this service or on this
website. On this site, there may be third party content, content from authors or links to third-party sites or
pages, the contents of which are not verified, maintained, controlled or supervised by INK. INK is not responsible
for and assumes no liability for the accuracy, completeness or timeliness of any third party content or authored
content provided herein or the information or contents of any linked sites or pages. The inclusion of any authored
content or link by us does not imply that INK recommends, approves or endorses the authored content or linked site
or pages. INK Edge® and INK Research® are registered trade-marks owned by INK Research Corp. SEDI®
is a registered trade-mark owned by the Alberta Securities Commission.Read less
Please make the indicated changes including the new text: US quotes snapshot data provided by IEX. Additional price data and company information powered by Twelve Data.
Interactive technical study charts by TradingView. Copyright © 2024 INK Research Corp. All rights reserved. All trade-marks or trade names not owned by INK Research Corp. are the property of their respective owners.