
INK CIN Index Rides Momentum to New 2016 High
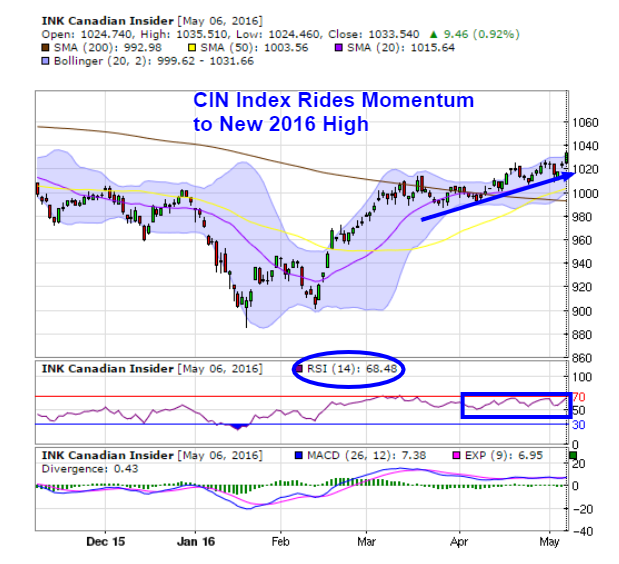
Thank you for joining us in a weekly technical look at the mid-cap oriented INK Canadian Insider (CIN) Index. Last week, the Index pulled back on its throttle and climbed nearly 1% (or 9 points), shattering its previous resistance of 1025-1027. The Index closed the week at 1033.54, and recorded a new 2016 high.
The Index's longer-term momentum indicator MACD, increased only 0.02 to 7.38 and continues to move in a widening consolidation pattern. On the other hand, its short term momentum indicator RSI remains in bull mode, as it tacked on nearly 2 points and closed the week at 68.48. One thing I will note is that over the past month, when RSI has closely approached 70 it has tended to retreat, at least temporarily.
Minor support is now at 1015, its 20 day moving average, and major support is at 1000. There is major resistance at 1031 (its top Bollinger band, 2 points below the Index's current position) and minor resistance at 1046 above.
Category:
- Please sign in or create an account to leave comments
Please make the indicated changes including the new text: US quotes snapshot data provided by IEX. Additional price data and company information powered by Twelve Data.