
INK CIN Index pulls back to lower Bollinger band
Technical Overview by Nicholas Winton, Hedgehog Trader and @HedgehogTrader on Twitter
Thank you for joining us in our weekly technical look at the mid-cap oriented INK Canadian Insider (CIN) Index. Since our last update, the CIN Index saw its already waning momentum grind to a halt, resulting in a breakdown below the 1000 support level to 975.
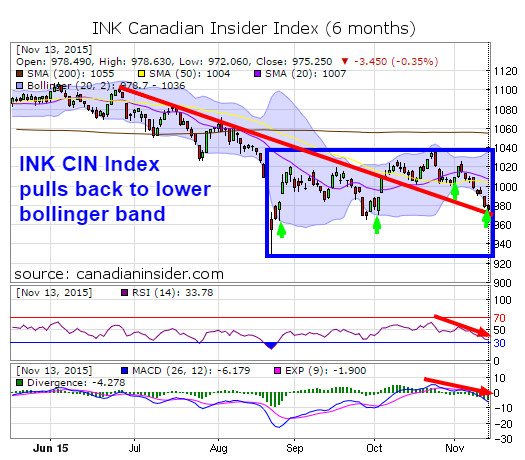
So does the Index's failure to break above 1020 or hold the critical 1000 level portend doom, including a return to August lows? Moreover, will the Paris terrorist attacks cause enough additional investor fear to fix the Index on an even more bearish course? In our view, not necessarily. For while the Index's momentum indicators, RSI and MACD, are clearly in a nosedive, we have reason for optimism.
For one thing, the red downtrend line illustrated on the chart, runs from the Index's July top, straight down to its present position, revealing a clear line of support. What's more, on three prior declines since September, we saw the Index plunge down to its lower Bollinger band, only to generate rebounds of 2% to as much as 6% (note the green arrows). On Friday, the Index once again hit the bottom Bollinger band, so the odds favour another bounce.
Dovetailing with the idea of a rebound is that we've also not seen RSI fall below 30 during this entire sideways consolidation phase (and we're just a hair above that right now at 33.78). And it's worth remembering that in late September, RSI had fallen to about the same level it is now before turning higher, eventually rising to levels above 50 and 60.
Finally, should the Index bounce and hold Friday's low, the Index would still maintain a healthy and gradual succession of higher lows since the summer sell-off at 930, 965, and 972.
What all of this means is that we could be seeing a wash-out move that provides renewed fuel for a rise. Important support levels are 970 and 960 and key overhead resistance levels include 1000 and 1020. The next few days should prove to be quite interesting.
Category:
- Please sign in or create an account to leave comments
Please make the indicated changes including the new text: US quotes snapshot data provided by IEX. Additional price data and company information powered by Twelve Data.