
INK CIN Index once again at important inflection point
Technical Overview by Nicholas Winton, Hedgehog Trader and @HedgehogTrader on Twitter
Thank you for joining us for our weekly technical look at the mid-cap oriented INK Canadian Insider (CIN) Index.
In our last update, the CIN Index surged to a new multi-week high and looked ready to make a big break out. Instead, the Index reacted as if it had hit a brick wall head-on upon reaching the 1040 resistance level and sank nearly 4% by week's end. As we can see, the red arrows on our chart now indicate 5 or 6 failed attempts to break and hold above 1020/1040 resistance.
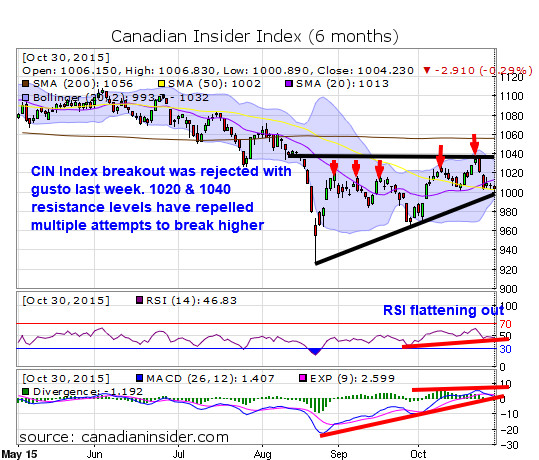
Some caution appears warranted as Relative Strength has again dipped below 50 and the Index's RSI uptrend over the past 6-7 weeks has begun flattening out. Not surprisingly, other momentum measures, MACD and its histogram have also flattened out.
The Index now finds itself at another important inflection point, such that it needs to rise sharply from its current position. That's because a breakdown of its rising lower trend-line which currently supports the Index at 1000, could result in a retest of its 960-970 level (or even lower to 920 support), resulting in a further extension of its sideways trading pattern. On the positive side, the Index's 9-week string of making higher lows is intact, and will remain intact, so long as we see the CIN Index maintain its 1000 support level.
Category:
- Please sign in or create an account to leave comments
Please make the indicated changes including the new text: US quotes snapshot data provided by IEX. Additional price data and company information powered by Twelve Data.