
The INK CIN Index looks positioned to turn higher
Technical Overview by Nicholas Winton, Hedgehog Trader and @HedgehogTrader on Twitter
Thank you for joining us for our weekly technical look at the mid-cap oriented INK Canadian Insider (CIN) Index. Since our update last week when we observed the bounce off its lower Bollinger band, the INK CIN Index has consolidated in an incredibly tight trading range. And although the Index rose just 6 points to 995.88 for less than a 1% gain on the week, it is well-positioned to break higher, ending a streak of lower highs that began after it made its late October high.
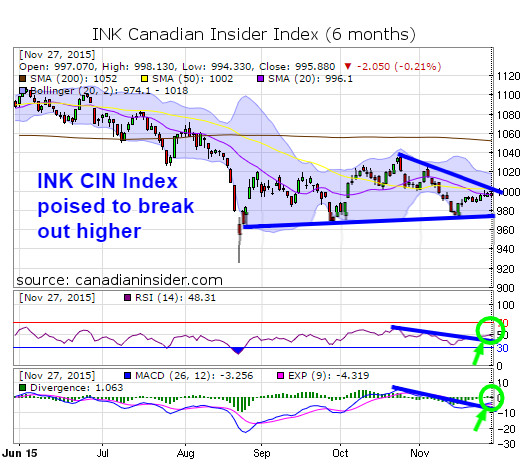
As matters stand, the Index's 20-day simple moving average at 996 is providing some resistance, having capped the Index the last several trading sessions. However, what provides renewed optimism for the bulls is that our two momentum indicators RSI and MACD have now turned up bullishly through their own respective downtrends which began in that same late October time-frame. In addition, RSI is now less than 2 points from reaching the key 50 level. This is important because when RSI climbs above 50, the index tends to stop drifting and begins to accelerate to the upside.
Are our newly bullish momentum indicators hinting at the CIN Index's break above 1000? We believe that's exactly what's happening.
Now, should the Index in fact break above 1000, its next move is likely a 2% rally to 1020, a resistance level that has halted 5 of 6 rallies this fall. Key support remains in the 970-980 range.
Category:
- Please sign in or create an account to leave comments
Please make the indicated changes including the new text: US quotes snapshot data provided by IEX. Additional price data and company information powered by Twelve Data.