
INK CIN Index Bounces Modestly Off Lower Bollinger Band
Technical Overview by Nicholas Winton, Hedgehog Trader and @HedgehogTrader on Twitter
Thank you for joining us for our weekly technical look at the mid-cap oriented INK Canadian Insider (CIN) Index.
Despite the Paris attacks and extreme negative investor sentiment, the INK CIN Index bounced off its lower Bollinger band, as we suggested was likely. The bounce has so far been modest, clocking in at around 2%. More importantly, the index still remains under the key 1000 level. The Index needs to make some headway this week in order to avoid having the 1000 level join 1020 as another tough-to-crack resistance level.
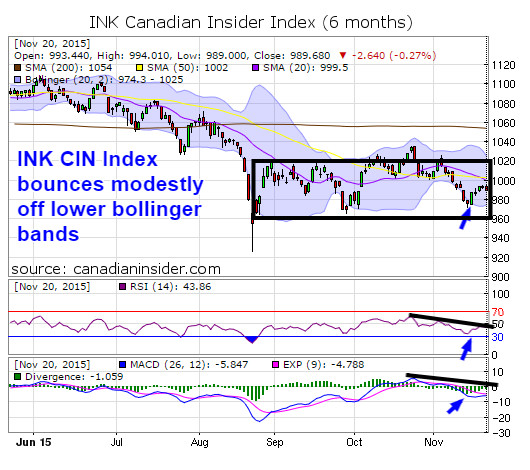
Momentum has improved in the last week, as the Relative Strength Indicator has bumped up from 33 to 43.86; but RSI needs to rise further, to above 50, in order to break its month-long downtrend. MACD has also been on the rebound and the histogram has moved from modestly negative back to neutral.
Looking ahead, a further rise in the Index could trigger a MACD buy signal (an event that would telegraph further upside), as the more responsive and faster-moving blue line is only a hair away from from crossing above the slower moving red line.
Overhead resistance is currently at 1000 and 1020, while key support remains at 970 and 960.
This sideways consolidation appears as though it could play out for a few more weeks yet.
Best Nike Sneakers | Vans Shoes That Change Color in the Sun: UV Era Ink Stacked & More – Pochta News
Category:
- Please sign in or create an account to leave comments
Please make the indicated changes including the new text: US quotes snapshot data provided by IEX. Additional price data and company information powered by Twelve Data.