
INK Canadian Insider Index waves second 'bull flag'
The INK Canadian Insider (CIN) Index added a miniscule three points last week to close at 1100. However, the chart tells a much more bullish story.
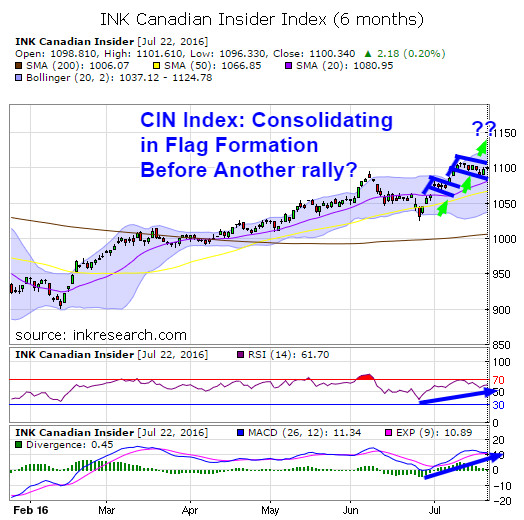
I have illustrated in blue two similar bullish 'flag' consolidation and breakout patterns, one on top of the other. The first flag saw the Index break out after only about 4 sideways trading sessions. This most recent flag has seen consolidation of 8 trading days. It's worth noting that most often, these bullish flags follow the prevailing trend, and especially when momentum remains strong. What adds extra bullish flavour for the week ahead is Friday's close was near the top of the flag, just 8 points from 2016 highs.
Speaking of momentum, our short-term indicator RSI remains strong, and was largely unchanged from last week, dipping just 2.5 points to 61.70. MACD dipped slightly to 11.34 from 12.59.
Resistance is at 1100 and 1110 while support lies at 1078 and 1071. Will the waving of a second flag spur on the charge of the bull? Stay tuned.
Category:
- Please sign in or create an account to leave comments
Disclaimer :: Use of this site is subject to, and your continued use
constitutes your express agreement to be bound by, our Legal and Terms of Use. Any commercial use of this site is
strictly prohibited. Canadianinsider.com is operated by INK Research Corp (INK). INK provides general information.
INK has made all reasonable efforts to ensure that all information provided is accurate at the time of inclusion;
however, there may be errors. INK makes no guarantee of accuracy or completeness. All information and opinion
expressed herein is subject to change without notice. Read more...Insider information is based on filings made on the System
for Electronic Disclosure for Insiders (SEDI®). Data is provided “as is” and by using this site
you acknowledge that the information which comprises the data is filed by or on behalf of the SEDI filers or other
parties legally required or permitted to do so. Filings may at any time contain errors and by using this site you
acknowledge this fact. INK is not an investment advisory service, a financial planner, an investment advisor nor a
securities advisor. INK does not purport to tell people, or suggest to people, what they should buy or sell for
themselves. Opinions and recommendations contained herein should not be construed as investment advice. Do not
assume that any recommendations, insights, charts, theories, or philosophies will ensure profitable investment.
Users should always consult with and obtain advice from their professional licensed financial advisor, including
their tax advisor, to determine the suitability of any investment. INK recommends that anyone making an investment
or trading securities do so with caution. Users should perform full due diligence and investigate any security
fully before making an investment or before the execution of a security trade based upon information learned
through INK. Investors should obtain annual reports and other company information to complete their own due
diligence in any investment. Neither INK nor anyone affiliated with INK is responsible for any investment decision
made. INK employees may have an ownership or investment interest in any stock mentioned in this service or on this
website. On this site, there may be third party content, content from authors or links to third-party sites or
pages, the contents of which are not verified, maintained, controlled or supervised by INK. INK is not responsible
for and assumes no liability for the accuracy, completeness or timeliness of any third party content or authored
content provided herein or the information or contents of any linked sites or pages. The inclusion of any authored
content or link by us does not imply that INK recommends, approves or endorses the authored content or linked site
or pages. INK Edge® and INK Research® are registered trade-marks owned by INK Research Corp. SEDI®
is a registered trade-mark owned by the Alberta Securities Commission.Read less
Please make the indicated changes including the new text: US quotes snapshot data provided by IEX. Additional price data and company information powered by Twelve Data.
Interactive technical study charts by TradingView. Copyright © 2024 INK Research Corp. All rights reserved. All trade-marks or trade names not owned by INK Research Corp. are the property of their respective owners.