
INK Canadian Insider Index tumbles alongside markets ahead of US election
Thank you for joining us in a weekly technical look at the mid-cap oriented INK Canadian Insider (CIN) Index. Last week, the Index fell 58.1 points or 5.2% to 1050.80.
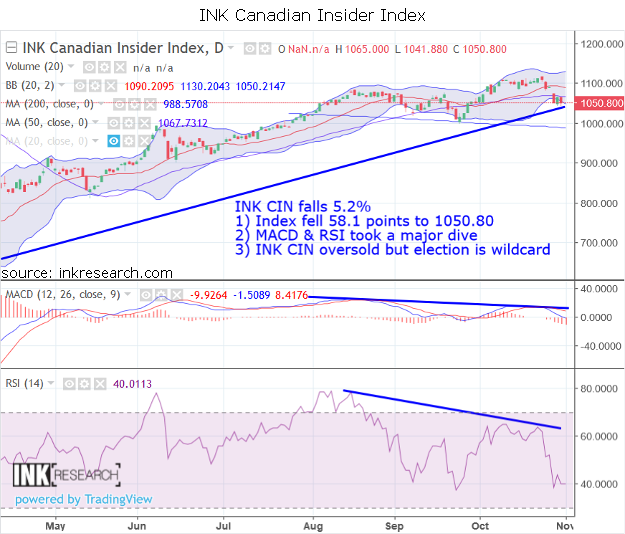
MACD, our long-term momentum indicator, tumbled 9.41 points to -9.92. Our short-term momentum indicator, RSI, plunged 36% or 22.17 points to 40.02. MACD is a longer-term buy/sell indicator. It is most useful when it's trending in the same direction as RSI for extended periods. Indeed, MACD has been stuck in a tight channel, for the most part between +10 to -10, over the past few months and, not surprisingly, the INK CIN has not been able to break out. What's more, MACD has been making lower highs and lower lows since mid-August, and a bullish long-term momentum signal would only be generated if it can break above the line at about 15-20.
In addition, our short-term indicator, RSI, finds itself near its recent lows of late September (37.55) which saw the Index respond by rebounding strongly. September's low RSI reading is only exceeded by the March crash which registered a sub-20 RSI capitulation that sparked a multi-month rally. With RSI and MACD declining so sharply, investor sentiment has taken a beating which is constructive in making the case for an advance.
Support is now at 1050.21 (lower Bollinger band) and 1080. Resistance is at 1110 and 1129 (upper).
As far as performance goes, the INK Canadian Insider Index beat the SPDR S&P 500 ETF (SPY*US) (-5.56%), platinum (-6.43%), and crude oil –10.19% but lagged gold (-1.33%), copper (-2.6%), and silver (-4.17%).
The INK CIN, world markets, and metals are now all oversold after sinking ahead of the uncertainty of the US election this week. Until we see the dust clear and a clear winner, it is best to trade lightly. The fact that the Index has pierced its lower Bollinger band and that its RSI trades near September lows provides conditions for a potential reversal, but only if the election chaos avoids bringing further weakness along with it.
The INK Canadian Insider Index is used by the Horizons Cdn Insider Index (HII).
Category:
Please make the indicated changes including the new text: US quotes snapshot data provided by IEX. Additional price data and company information powered by Twelve Data.