
INK Canadian Insider Index ticks 1317.05, closes at 1308.78
Thank you for joining us in a weekly technical look at the mid-cap oriented INK Canadian Insider (CIN) Index. Early in the week, the Index bolted nearly 20 points higher and closed at its week high of 1317.05. Despite retracing some of those gains, the Index managed to close above the key 1300 level every day of the week for the first time in a month and gained 11.6 points or nearly 1%.
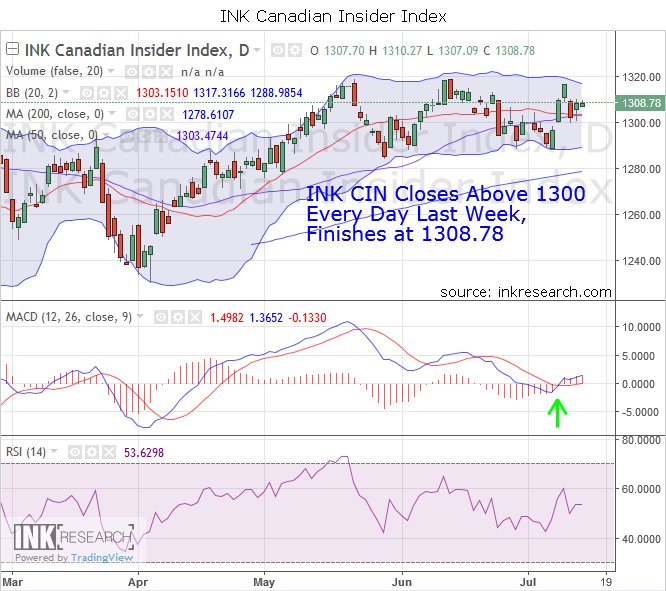
Our short-term momentum indicator ticked up 6.13 points or about 12% to 53.63. Our long-term momentum indicator MACD more than doubled to 1.49 and simultaneously triggered a MACD buy signal, the Index's first in over a month.
Support is at 1289 and 1300. Resistance is at 1310 and 1317.
The US dollar, which I see as a key headwind for the INK CIN Index and commodities, has remained near its 2018 highs for the last month. And yet, US dollar's chart displays concerning negative divergences in momentum. For while the US dollar recently made new highs, its RSI and MACD momentum indicators did not make highs themselves and have looked limp. Such a divergence is often an early indication of an exhausted uptrend and an impending downtrend. What's more, the greenback's MACD indicator is on a sell signal and has, in fact, been bearishly trending downward for over a month. So, the US dollar 'correction watch' remains alive and well.
As for the INK CIN, this is now the tenth week in a row it has closed above 1288-89, a key support level indicating strength. At the same time, the Index has made three forays toward the 'wall-like' 1317-1319 resistance zone in the past month and has been turned back on each occasion. Of course, we must also keep in mind that the more attempts on a resistance level, the more likely we are to see a successful break. The next few weeks should prove most interesting.
Category:
- Please sign in or create an account to leave comments
Please make the indicated changes including the new text: US quotes snapshot data provided by IEX. Additional price data and company information powered by Twelve Data.