
INK Canadian Insider Index strikes new all-time high at 1214.94
Thank you for joining us in a weekly technical look at the mid-cap oriented INK Canadian Insider (CIN) Index. Last week, the Index powered ahead 9.19 points as it completed the bullish 'W' reversal pattern as we had previously suggested, to close at 1209.62. What's more, the Index exceeded its previous high of 1213.42 with a new intraday high of 1216.11 and established a brand new all-time closing high of 1214.94.
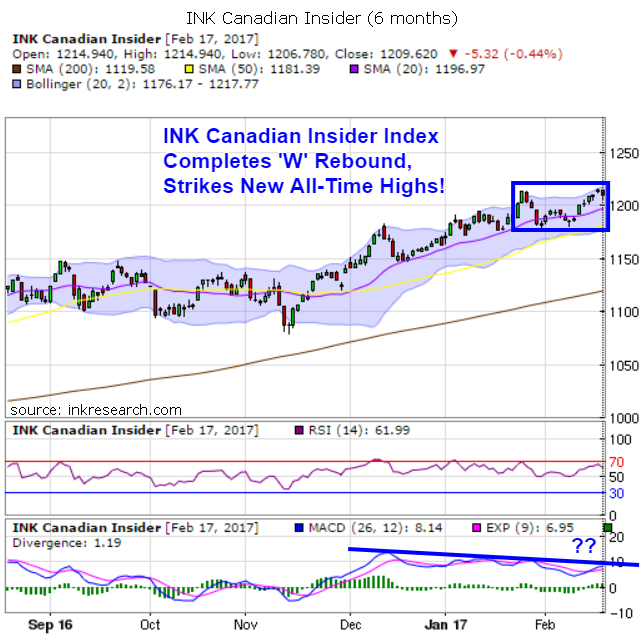
Momentum has been on a clear upswing over the last two weeks for the INK CIN. The Index's short-term momentum indicator (RSI) added 2.42 points to rise to a robust reading of 61.99. The Index's MACD indicator surged 64% to rise from 4.96 to 8.14. And the fast line has crossed above the slow line to go back onto a technical buy signal. We are watching for a potential move above 15 on MACD, as that would likely give us an indication of an imminent breakout to much higher levels.
The Index's support levels appear solid at 1200 and 1197 (its 20-day moving average), while 1210 and the 1215-1216 area provide overhead resistance.
Feel free to follow me on Twitter at http://www.twitter.com/HedgehogTrader for analysis, predictions on specific stocks and market commentary.
Authentic Sneakers | Preview: Nike Air Force 1 "Tear-Away" Fauna Brown - Gov
Category:
- Please sign in or create an account to leave comments
Please make the indicated changes including the new text: US quotes snapshot data provided by IEX. Additional price data and company information powered by Twelve Data.