
INK Canadian Insider Index staring at downward momentum
Technical Overview by Nicholas Winton, Hedgehog Trader and @HedgehogTrader on Twitter
Thank you for joining us in a technical look at the mid-cap oriented INK Canadian Insider (CIN) Index. In our last update, we observed that even a small burst of upside energy could lift the INK CIN Index above the 1000 level, clearing a line of resistance that extends downward from mid-October.
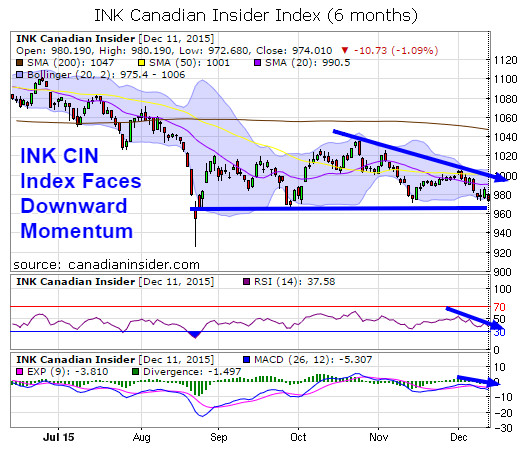
It was not to be, however, as the market stonewalled the attempted breakout for the third time in two months and sent the Index lower by Friday's close. Not surprisingly, technical momentum reflects this failed forward movement, as RSI is in a two-week downtrend and gives us a current reading of 37. Last week, our MACD indicator saw its fast red line cross down over its slower red line, suggesting momentum is back in the bears' court.
The index has also broken below the 980 level support we outlined. It closed at 974.10 which is below its 20-day moving average of 990.5 as well as its lower Bollinger band which is now at 975.4. Its major support is now in the low to 960-965 range. Below this level, our main reference point for support is the spike bottom from August just above 920.
The INK CIN Index, like many others, is correcting ahead of the Dec 16 interest rate decision by the US Federal Reserve. It's quite possible we see the Index start to stabilize once this uncertainty is removed. What's more, a quick downward spike that stretches the index below the lower Bollinger band could bring about a positive reversal, just as we saw in late August.
short url link | spike shoes nike running shoe size chart boys
Category:
- Please sign in or create an account to leave comments
Please make the indicated changes including the new text: US quotes snapshot data provided by IEX. Additional price data and company information powered by Twelve Data.