
INK Canadian Insider Index: set to 'wow' from a bullish double bottom?
Thank you for joining us in a weekly technical look at the mid-cap oriented INK Canadian Insider (CIN) Index. Early last week, the Index continued to trade in a tight range and then on Wednesday dipped to 1180 or 8 points short of its 50-day moving average (1172) before closing strongly near the day's highs. By doing so, the Index is carving out a double bottom pattern and so far this has been confirmed, for the Index went on to gap up and rise 13 points or over 1% over the last 2 days to close at 1200.27 for 7 point gain on the week. The Index's latest chart action is starting to look very promising indeed.
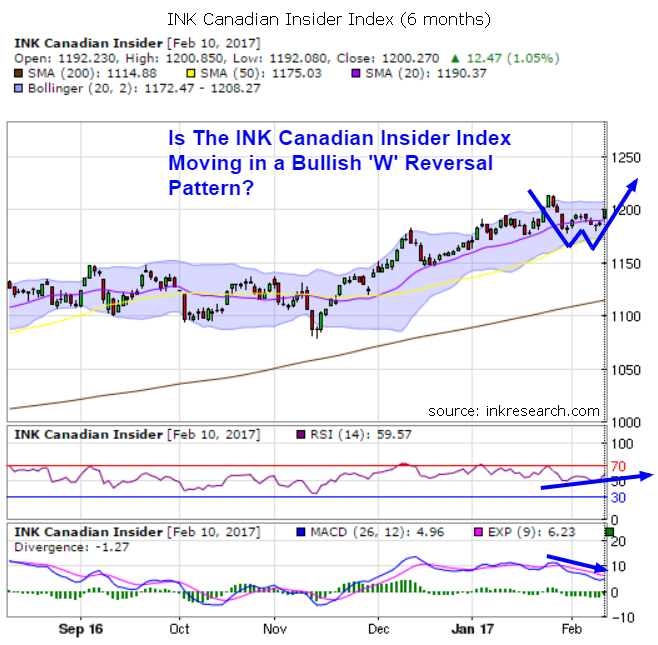
The Index's short-term momentum indicator (RSI) added 3.47 points to 59.57. The Index's MACD indicator dropped 2 points to 4.96.
The Index's support levels are at 1180 and 1190 (its 20-day moving average, while 1200 and 1208 (upper bollinger band) provide overhead resistance.
My suggestion that the Index's momentum was necessarily slowing as a way to work off the strong level of bullish sentiment (built up in January's rally to new highs) before it could launch another major rally is looking more plausible. Of course, my bullish outlook for the Index is also backed by my forecast that US, Canadian and world markets are set to embark on a powerful mania-like rally that will shock many observers.
Feel free to follow me on Twitter at http://www.twitter.com/HedgehogTrader for analysis, stock ideas and commentary during what I am predicting will be a very exciting and profitable period for both traders and investors.
Category:
- Please sign in or create an account to leave comments
Please make the indicated changes including the new text: US quotes snapshot data provided by IEX. Additional price data and company information powered by Twelve Data.