
INK Canadian Insider Index seeks bottom around 900 level
Technical Overview by Nicholas Winton, Hedgehog Trader and @HedgehogTrader on Twitter
Thank you for joining us in a technical look at the mid-cap oriented INK Canadian Insider (CIN) Index. It's been a gruelling few weeks for stock markets worldwide, and Canadian stocks were no exception. The INK CIN Index has fallen 9% since running into resistance once again at the 1000 level in late December.
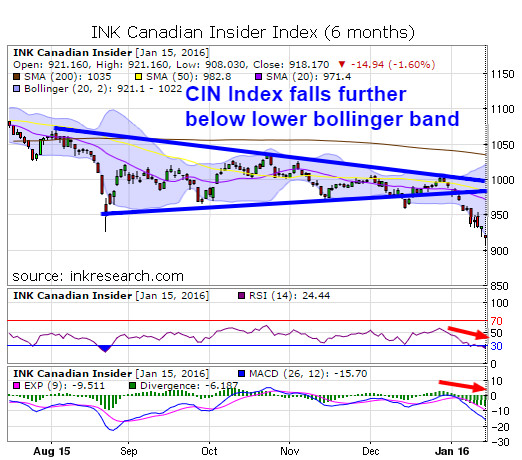
In our last update, we thought the Index had a good shot at rebounding since its RSI had previously not dropped below 30 and as the Index had dropped below the Bollinger band, an event that frequently triggers a reversal to the upside. What happened since then is that the correction that was already underway quickly snowballed as investors became more and more fearful, selling virtually every sector in the market - and that's how we end up with such exaggerated moves to the downside.
Our momentum indicators are not surprisingly quite negative - with the Index's RSI now at a multi-month low of 24.44 and MACD at -15.7. For comparison's sake, at their summer lows, RSI hit a low of 18 and MACD fell to -20. So we're now in the same ballpark as August, as far as how oversold stocks are and how close we might be to a rebound. The Index again finds itself below its lower Bollinger band (and already stretched quite far below its 20-day moving average) and it will be interesting to see if these low levels are enough to incite a rebound or if a further pullback is needed to bring back buyers in size.
Resistance is now around 950-960 where support previously existed. While there are no guarantees, support should be substantial around the 900 level since that is where the CIN Index consolidated for a number of months in 2013, before embarking on a 20% rise.
If there's a silver lining in such a pessimistic environment, it's that such huge emotionally-charged market declines are often followed by equally powerful rebounds - such as we saw following the late August sell-off. That's when we saw the INK CIN Index drop as low as 926 before rallying to 1020 for a 10.1% gain from its lows within a few weeks time.
Category:
- Please sign in or create an account to leave comments
Disclaimer :: Use of this site is subject to, and your continued use
constitutes your express agreement to be bound by, our Legal and Terms of Use. Any commercial use of this site is
strictly prohibited. Canadianinsider.com is operated by INK Research Corp (INK). INK provides general information.
INK has made all reasonable efforts to ensure that all information provided is accurate at the time of inclusion;
however, there may be errors. INK makes no guarantee of accuracy or completeness. All information and opinion
expressed herein is subject to change without notice. Read more...Insider information is based on filings made on the System
for Electronic Disclosure for Insiders (SEDI®). Data is provided “as is” and by using this site
you acknowledge that the information which comprises the data is filed by or on behalf of the SEDI filers or other
parties legally required or permitted to do so. Filings may at any time contain errors and by using this site you
acknowledge this fact. INK is not an investment advisory service, a financial planner, an investment advisor nor a
securities advisor. INK does not purport to tell people, or suggest to people, what they should buy or sell for
themselves. Opinions and recommendations contained herein should not be construed as investment advice. Do not
assume that any recommendations, insights, charts, theories, or philosophies will ensure profitable investment.
Users should always consult with and obtain advice from their professional licensed financial advisor, including
their tax advisor, to determine the suitability of any investment. INK recommends that anyone making an investment
or trading securities do so with caution. Users should perform full due diligence and investigate any security
fully before making an investment or before the execution of a security trade based upon information learned
through INK. Investors should obtain annual reports and other company information to complete their own due
diligence in any investment. Neither INK nor anyone affiliated with INK is responsible for any investment decision
made. INK employees may have an ownership or investment interest in any stock mentioned in this service or on this
website. On this site, there may be third party content, content from authors or links to third-party sites or
pages, the contents of which are not verified, maintained, controlled or supervised by INK. INK is not responsible
for and assumes no liability for the accuracy, completeness or timeliness of any third party content or authored
content provided herein or the information or contents of any linked sites or pages. The inclusion of any authored
content or link by us does not imply that INK recommends, approves or endorses the authored content or linked site
or pages. INK Edge® and INK Research® are registered trade-marks owned by INK Research Corp. SEDI®
is a registered trade-mark owned by the Alberta Securities Commission.Read less
Please make the indicated changes including the new text: US quotes snapshot data provided by IEX. Additional price data and company information powered by Twelve Data.
Interactive technical study charts by TradingView. Copyright © 2024 INK Research Corp. All rights reserved. All trade-marks or trade names not owned by INK Research Corp. are the property of their respective owners.