
INK Canadian Insider Index rumbles to 1000, faces resistance
Thank you for joining us in a weekly technical look at the mid-cap oriented INK Canadian Insider (CIN) Index. In our review one week ago, we suggested that the seemingly bearish candle two Fridays ago might only mean a slight pause (and not a meaningful reversal). After a mere one-day pause, the Index turned on the afterburners and surged 2.4% or 23.4 points to 995.09. Interestingly, the Index closed Friday much the way it closed the previous Friday, with a reverse hammer.
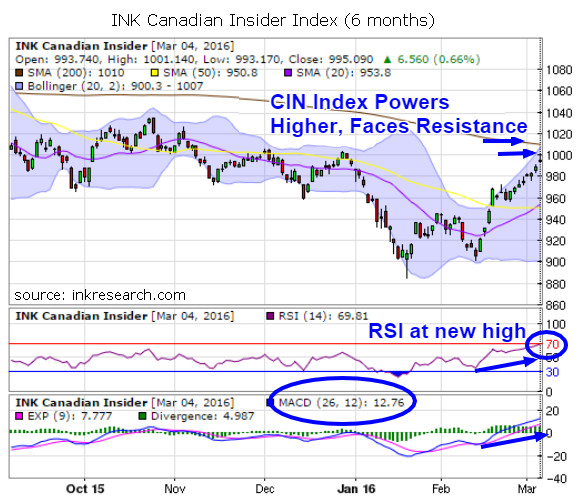
Short-term momentum indicator RSI was red hot, closing at an 11-month high of 69.81. Equally as impressively, MACD the Index's longer-term measure of momentum nearly doubled, climbing to 12.76.
Resistance now comes into play at the round number of 1000 which held the Index back for all but a few weeks of the Fall, looms as a potential hurdle, as well as at 1010, the 200-day moving average of the Index. A break above the latter would be particularly bullish, especially given the Index's snowballing momentum. Above 1010, there is little resistance until the 1100 mark, and a close above 1050 could incite a lightning fast gain of anywhere from 40-90 points (or as much as 9%).
At present, minor support is 980 and major support is 960. Minor resistance is 1000 and major resistance is 1010.
Given that reverse hammer close on Friday (similar to the previous Friday), it will be interesting to see whether the Index repeats last week's action where it takes a breather before making new highs or whether it finally corrects after this massive rally which has now lifted the Index 13% off its January lows.
That said, there are no bearish divergences in the chart and momentum appears clearly in the bulls' favour.
Category:
- Please sign in or create an account to leave comments
Please make the indicated changes including the new text: US quotes snapshot data provided by IEX. Additional price data and company information powered by Twelve Data.