
INK Canadian Insider Index rallies, eyes breakout
Thank you for joining us in a weekly technical look at the mid-cap oriented INK Canadian Insider (CIN) Index. Last week, the Index bullishly popped and powered through its 1120-22 resistance zone, returning to the vicinity of its 2016 highs, before drifting down slightly to close at 1134.42, locking in an 11-point gain. Clearly, the Index enjoyed a boost shared by world markets which rallied on the news that a dovish US federal reserve declined to raise interest rates until after the US general elections in November.
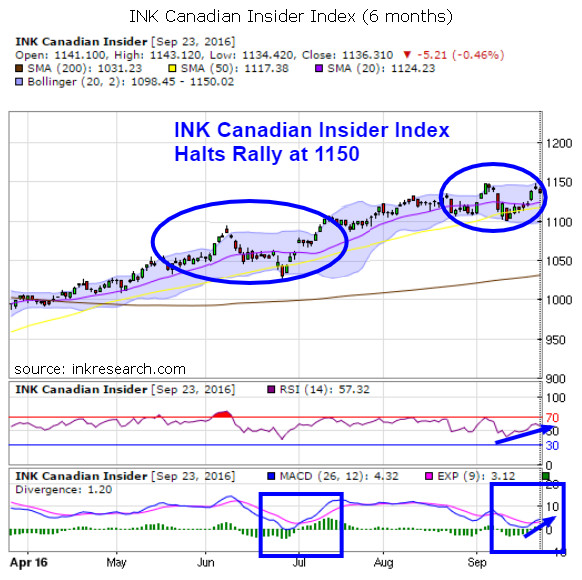
What's also clear is our short-term momentum indicator RSI found its dove's wings and climbed 9 points or 20% to 57.32. (We had suggested earlier that a return to the 50s was likely based on past behaviour.)
Our long-term momentum indicator MACD added what appears to be a nominal 3.32 points. But having started from its low 1.00-point level, this meant it actually achieved a substantial 332% increase as it finished the week at 4.32. Equally notable was that MACD saw its fast line (blue) cross above its slow (red) line, a technical event that often foreshadows trend changes.
What's also interesting is there appears to be a similar MACD cross-over in its chart around late-June when the Index began to lift off and generated a 10% rise. As we've noted with blue circles, even the Index's price action holds echoes of the past.
Support lies at 1121 and 1100 (the latter held when the Index needed it most in early September). Resistance is at 1135 and 1150. A close above 1150 in the coming weeks would be very bullish.
Authentic Nike Sneakers | Patike – Nike Air Jordan, Premium, Retro Klasici, Sneakers , Iicf
Category:
- Please sign in or create an account to leave comments
Please make the indicated changes including the new text: US quotes snapshot data provided by IEX. Additional price data and company information powered by Twelve Data.