
INK Canadian Insider Index rallies 2%, looks to head higher
Thank you for joining us in a weekly technical look at the mid-cap oriented INK Canadian Insider (CIN) Index. The Index finished hammering out a bottom at the 1120-1125 level (completing what looks like a triple bottom) in the first day or two of last week. The INK Canadian Insider Index then raged 23 points higher by week's end for a gain of 2%, closing at 1146.95, just off its highs.
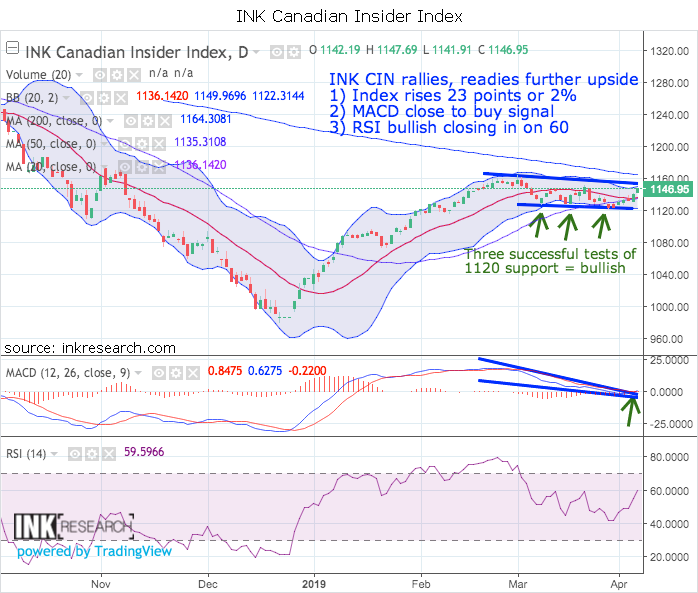
A mere two weeks after making its 2019 low, our short-term momentum indicator RSI erupted 43% or 18 points to finish at a bullish 59.60. Our long-term indicator MACD climbed 3.85 to 0.85. More importantly, the fast blue line has just crossed above the slow red line triggering a MACD buy signal.
Support is at 1136 and 1122.30 (its lower Bollinger band). Resistance is now at 1150 (middle Bollinger band) and at 1164.30 (200-day moving average).
Until just recently, the Index seemed to be meandering sideways in spite of ongoing strength in copper and US markets. Then early last week the INK CIN Index did something I suggested it would need to do when it pulled back 1 point (it pierced its lower Bollinger band when it fell to 1121.27) and subsequently triggered the upside reversal we saw.
The Index moved decisively through the 1140 area and now looks ready to take aim at 1150 and 1160. The INK CIN's move last week was impressive. For its 2% gain compared well with the S&P 500 (+2.15%) and strongly bested copper (down 1.41%). My forecast is that commodities and risk-on sectors are about to see a parabolic melt-up play out over the next 2-3 months. Bulls, strap on your seatbelts. Bears, fasten your helmets.
The INK Canadian Insider Index is used by the Horizons Cdn Insider Index ETF (HII), a 2017 and 2018 Fundata Fundgrade A+ ® award winner.
Category:
Please make the indicated changes including the new text: US quotes snapshot data provided by IEX. Additional price data and company information powered by Twelve Data.