
INK Canadian Insider Index pulls back as momentum falters
The INK Canadian Insider Index initially rallied last week, but soon found resistance at its top Bollinger band in the 1130-1135 area (marginally exceeding its previous August high of 1132.73) and ran out of steam, ending its week down 14 points or 1.2% with a close at 1115.40.
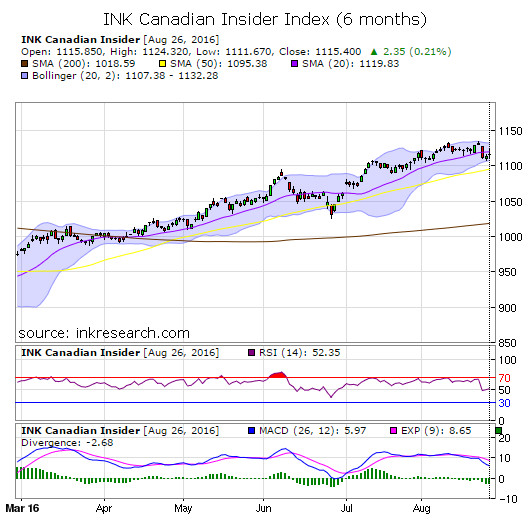
RSI dropped by nearly 11 points or 17% to 52.45 and MACD slumped nearly 4.8 points or 44% to 5.97. Last week, we observed both momentum measures had been locked in a fairly tight range in recent weeks. Notable was the fact RSI had been in the robust 60 range which would normally be enough to further a significant advance, and yet the Index posted a mere 0.5% advance in price over the last 4-5 weeks.
In hindsight, those were perhaps clues of an impending correction.
So, what now? We may well be seeing a pullback that helps to wring out bullish sentiment that has built up over the last several months- and in the process creates a wall of worry for the Index to climb once again.
For reference, the last big pullback for the Index was in June when it briefly breached the 50 day moving average, currently at 1095.38. So, bulls would ideally like to see that level hold firm in the days ahead.
Going forward, bulls would like to see the long term momentum indicator MACD perk up and break above the rather modest 10-15 level which has capped it since the start of the year. Indeed, new highs on MACD would be a strong indication the Index is ready to resume its dominant rising trend.
Resistance is at 1130 and 1120 while support is at 1100 and 1070.
Category:
- Please sign in or create an account to leave comments
Please make the indicated changes including the new text: US quotes snapshot data provided by IEX. Additional price data and company information powered by Twelve Data.