
INK Canadian Insider Index perks up after a rest!
The INK CIN Index may have gained a meagre 3 points to 1004.26 since our last update, but further analysis provides several reasons for renewed optimism as this new week opens.
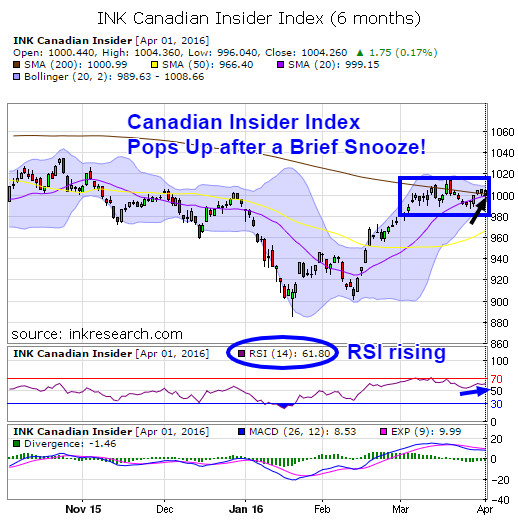
First and foremost, our short term momentum indicator RSI has sprung back to life, surging to 61.80 after a 2-3 week decline into the low 50s. If it can maintain its current strength or even build upon it, the odds of a breakout to new multi-month highs greatly increase.
MACD, the slower moving measure of momentum, remains fairly placid and has, in fact, decreased by 3 points since last week. That doesn't alarm us greatly, as MACD tends to lag RSI as an indicator of short-term trends, and MACD has also traded in a fairly tight 9 to 14 range since March 7th. On the bullish side, the blue (fast) line is rapidly approaching the red (slow) line. Now, should the fast line cross up and over the slow line, that crossover would be a very bullish development for its chart as momentum would clearly be shifting to the bull side.
Major resistance lies at 1015, a level that stopped the Index in its tracks on back to back days a couple of weeks ago. Minor resistance is at 1005, an area the Index has been consolidating just under, over the last 3 trading days. Minor support is at the 1000 level which has kept the Index afloat these last 3 days, while major support is in the 980-990 area where the Index bullishly bounded off no fewer than 5 times in March.
The strength and resilience of this 980-990 support area over the last few weeks is bullish, as is the fact that the Index managed to pop back above the 1000 mark without too much difficulty. The final and most bullish sign we note is that the Index is now above its 200- and 50- day moving averages that have quietly retreated over the past few weeks.
All of the above suggests the Index is now in a position to make an advance that could catch many by surprise.
Category:
- Please sign in or create an account to leave comments
Please make the indicated changes including the new text: US quotes snapshot data provided by IEX. Additional price data and company information powered by Twelve Data.