
INK Canadian Insider Index: the pause that refreshes or time for a rest?
Last week, the INK Canadian Insider (CIN) Index was guns blazing hot after a 120+ point rise off its January lows, and it first made a couple of failed attempts to clear the 1000 level before finally succeeding. However, the 1010-1015 level put up another roadblock on two more occasions, and the Index ended up closing at 1001.51. With that close, the Index was down 5 points over the past week.
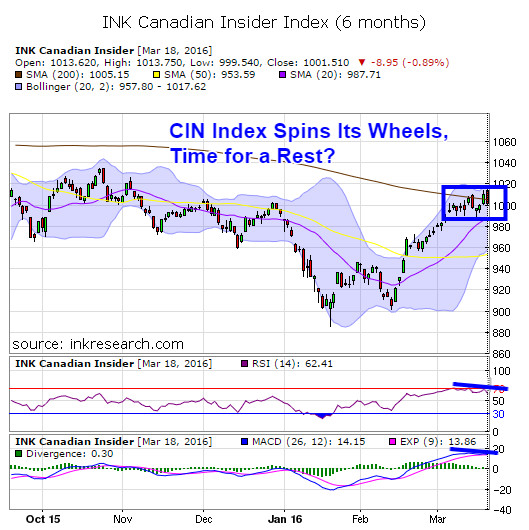
One thing we note is the negative divergence of its RSI over the past couple of weeks, as RSI has been trending ever so slightly downward, making lower highs. That said, RSI is still above 60 and as long as that level holds, the Index remains a threat to move up.
If the Index fails to break the 1010 level over the next week or so, we might simply see more sideways consolidation before another thrust higher is attempted. MACD is also not spilling too many secrets; it remains positive at a reading of 13 - but has trended down ever so slightly. The blue 'fast line' has pulled back to touch the red slow line, showing signs of normal consolidation. Bulls want to see momentum pick up fairly soon and have the blue line clearly climb back above the red line, maintaining the MACD bullish signal triggered in late January when the blue crossed the red line from below.
The Index has two major supports backing it up: first at the 1000 level and, secondly, in the 980-990 zone. But it also faces heavy resistance both at its 200 day moving average at 1005 and in the 1010-1015 area.
This week, investors will be watching closely to see if the Index's momentum indicators can buck their recent downtrend.
Category:
- Please sign in or create an account to leave comments
Please make the indicated changes including the new text: US quotes snapshot data provided by IEX. Additional price data and company information powered by Twelve Data.