
INK Canadian Insider Index hits new intraday high, gains 15.4% year to date
Thank you for joining us in a weekly technical look at the mid-cap oriented INK Canadian Insider (CIN) Index. Last week, the Index, which had surged back to 1132 capitulated to 1120.73 and then made an electric rise that crushed 1140 resistance and tagged 1150.38 for a brand new 2016 intraday high. The Index closed Friday at 1144.64, up 12 points for a 1% gain.
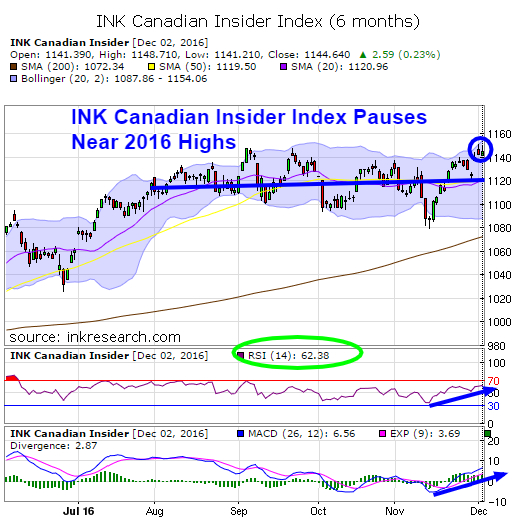
The Index's short-term momentum indicator rose 5.5 points or 10% to 62.38. A move into the 60 range is a bullish development that suggests we are seeing a significant yet sustainable level of momentum that could push the Index upward and into new highs.
The Index's MACD indicator added nearly 3 points and rose 73% to 6.79, as it built upon the long downtrend break the prior week. We will continue to monitor MACD for a move above the 15 level that capped it this past year. Should it clear this mark, we could see the Index begin to break out from the sideways consolidation it has undergone since July.
The Index's support levels are 1140 and 1130. 1150 and 1160 offer resistance. The Index's break above 1140 is a very bullish development since that area has acted as a 'rally-killer' on about half a dozen occasions. In fact, we may now be seeing the Index consolidating near its year highs just ahead of a breakout. We'll soon see.
There is no question the Index endured a rough storm from late October until early November, but the past two weeks has stunningly undone all damage and we can now report the Index has so far gained an impressive 160 points or 15.4% since January.
Category:
- Please sign in or create an account to leave comments
Please make the indicated changes including the new text: US quotes snapshot data provided by IEX. Additional price data and company information powered by Twelve Data.