
INK Canadian Insider Index finds resistance in 1115-1120 zone
Thank you for joining us in a weekly technical look at the mid-cap oriented INK Canadian Insider (CIN) Index. Last week, the Index had ideas of mounting a rally but soon succumbed to the selling that struck all markets, before bouncing modestly into week's end, closing nearly unchanged, gaining all of 0.05 points.
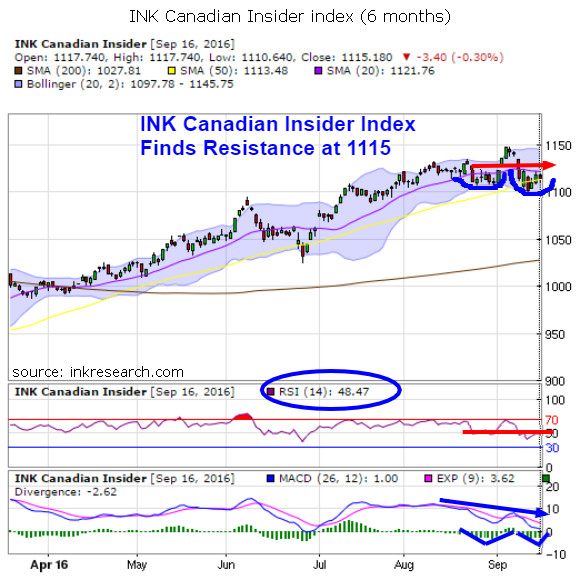
Our short-term momentum indicator RSI rose by 1.4 points to a still weak reading of 48.47. If RSI continues to remain under 50, it could spell trouble and deterioration for the Index. However, prior to the last 4 weeks of malaise, RSI registered at much higher levels for a spell of about 2 months, so we may yet see its momentum return. Our long-term momentum indicator MACD which had read 6.40 and has been struggling for some weeks, plunged and closed at 1.00. The MACD histogram may show signs of trying to put in a bottom here (as the two blue triangles or V's denote) but our long term momentum indicator has shifted squarely to the downside.
Resistance is now around 1121-1122 (its 50-day moving average which has capped it since September 12th) and 1135.
On the positive side, the Index's tumble last week took it back to 1100 where it successfully retested its support. But the Index, which faces some considerable momentum and resistance challenges, will need to dig deep to mount a significant advance if it wants to resume its upward trend.
Asics shoes | Air Jordan 4 University Blue Clothing New Era Bulls Hat
Category:
- Please sign in or create an account to leave comments
Please make the indicated changes including the new text: US quotes snapshot data provided by IEX. Additional price data and company information powered by Twelve Data.