
Is the INK Canadian Insider Index finding a higher range?
Technical Overview by Nicholas Winton, Hedgehog Trader and @HedgehogTrader on Twitter
Thank you for joining us for our weekly technical look at the mid-cap oriented INK Canadian Insider (CIN) Index. Since our last update, the CIN Index has been fairly quiet, initiating only a small rally to its 1020 resistance level before retreating back to its 1000 support. Its technical indicators MACD and RSI read neutral - seemingly waiting for the next market catalyst to drive their direction.
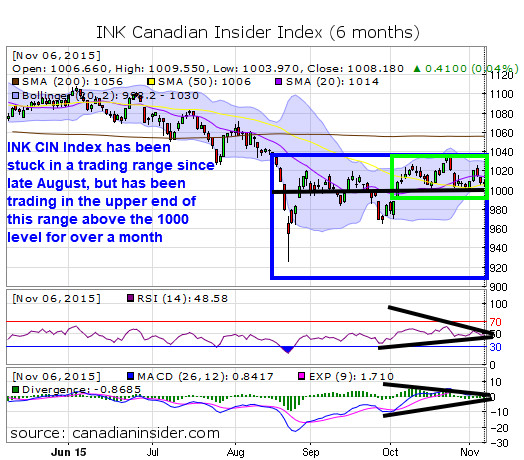
While the Index has been locked in a tight trading range for virtually the entire fall, one positive sign is that it has traded exclusively above the 1000 point level at the top right quadrant (marked by a green box) of its box pattern over the last month. We'll soon see if this new higher range can last. What we know is that the longer this critical 1000 level support remains intact, the stronger this line of support becomes. Of course, since major resistance at 1020 and 1040 have stone-walled rallies 6 or 7 times, this tight range of consolidation could continue even longer, perhaps even into year end.
If momentum doesn't pick up for the Index over the next week we can't rule out a flush back down to 960 as we saw in late September. However, given the resilience and persistence shown during its nearly 10-week journey since the late summer sell-off, the Index's behaviour suggests it is likely to be able to overcome weakness. That's because the chart's sideways pattern suggests to me it is biding its time until it can successfully break through resistance and escape its 'box.'
Impatient investors should take note that long bases and consolidations are considered very bullish. The longer the base moves sideways, the larger and more significant the ensuing rally tends to be.
Authentic Sneakers | Nike Air Force 1 , Sneakers , Ietp STORE
Category:
- Please sign in or create an account to leave comments
Please make the indicated changes including the new text: US quotes snapshot data provided by IEX. Additional price data and company information powered by Twelve Data.