
INK Canadian Insider Index ends 2016 +19.88%; MACD now key
Thank you for joining us in a weekly technical look at the mid-cap oriented INK Canadian Insider (CIN) Index. In our last update on Dec 18th, the Index had pulled back sharply to test its support at 1148.57 following its breakout that had reached an intraday high of 1182.57. Since then, the Index climbed quietly higher before closing the year at 1163.07. The Index was a top performer in 2016, returning 19.88% over the last year, including 6.59% over the last 3 months.
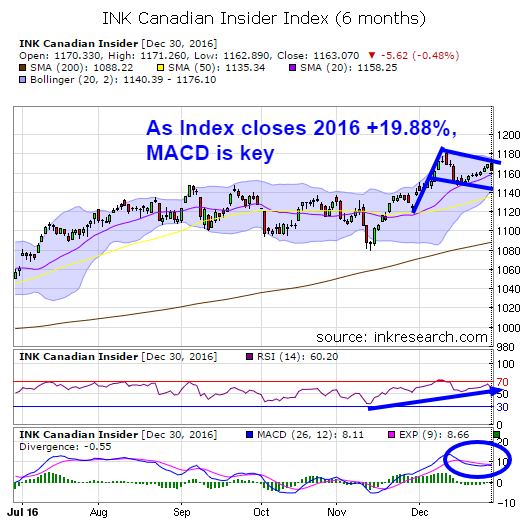
To end the year, the Index's short-term momentum indicator (RSI) rose 11% or 6 points to 60.20. However, the Index's MACD indicator dropped 2 points and fell 20% to 8.11 and is now well off its December high of 13.65. Of note, MACD's fast blue line has crossed a hair below the slow red line and bulls likely need a quick upturn to negate this recent weakness and avoid a trip back down to 1140 or below.
The Index's support levels are 1158 (its 20-day simple moving average) and 1150 (the area where the Index broke out in December), while 1168 and 1180 provide resistance.
We theorized the pullback we saw in mid-December was likely a pause that would re-energize the Index, and so far at least, that has been the case. Indeed, the chart of the Index has carved out a bullish-looking flag pattern.
The next major technical event bulls would like is for MACD to finally and firmly break above the 12-15 level that has capped it over the past year. This remains possible as MACD has been consolidating in the 8-9 range over the last couple of weeks. If that happens, the Index could form another flag and break out past 1180.
Running Sneakers | Preview: Nike Air Force 1 "Tear-Away" Fauna Brown - Gov
Category:
- Please sign in or create an account to leave comments
Please make the indicated changes including the new text: US quotes snapshot data provided by IEX. Additional price data and company information powered by Twelve Data.