
INK Canadian Insider Index consolidates under 1200
Thank you for joining us in a weekly technical look at the mid-cap oriented INK Canadian Insider (CIN) Index. The Index completed a small correction that had begun the week prior with a visit to a low of 1178.25 before rebounding back above its 20-day moving average (1188.84). The Index closed the week down about 5 points at 1193.32.
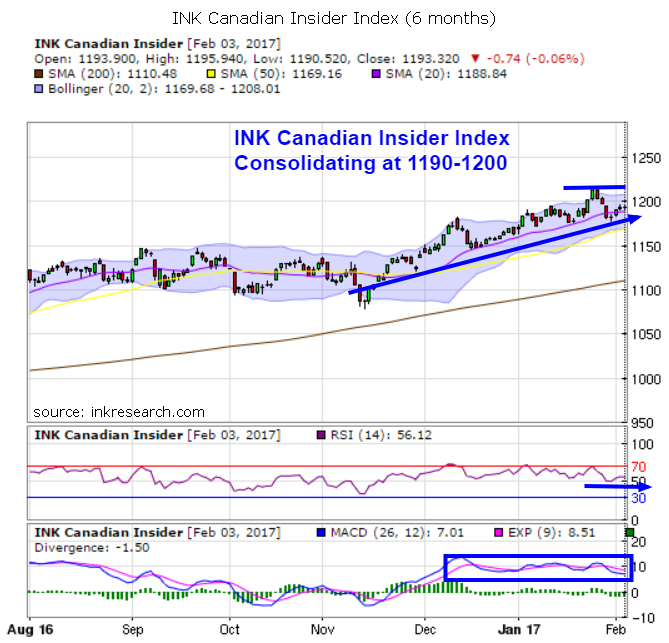
The Index's short-term momentum indicator (RSI) dropped 3.79 points to 56.12. The Index's MACD indicator dropped 4 points or 36% to 7.01 and continues to be capped at about the 13 level.
MACD has chopped back and forth between buy and sell indications while the Index continues to consolidate in a tight range; last week MACD moved back to a sell signal.
The Index's support levels are at 1188.84 (its 20-day simple moving average) and the 1176-1178 area, while 1200 and 1208-1212 provide overhead resistance.
The Index appears to be allowing some of its recent bullish sentiment to wear off before making an attempt at a major advance. Interestingly, in the event of further correction, the Index could still pull back to the 1150-1169 level and still remain bullish. Indeed, mid-November saw a dip to a similar degree (40-50 points) that threw all the bulls off the train in a bit of a sentiment refresh, before the Index made a substantial 90 point advance.
Authentic Nike Sneakers | Air Jordan Retro - 2021 Release Dates + Preview , Fitforhealth
Category:
- Please sign in or create an account to leave comments
Please make the indicated changes including the new text: US quotes snapshot data provided by IEX. Additional price data and company information powered by Twelve Data.