
INK Canadian Insider Index climbs 1%, notches new highs
Thank you for joining us in a weekly technical look at the mid-cap oriented INK Canadian Insider (CIN) Index. Last week, the Index continued to climb, closing at a record high of 1191.04 for a gain of nearly 12 points or 1%. What's more, the Index, which is now up a formidable 10% since mid-November, also reached an all-time intraday high of 1194.71.
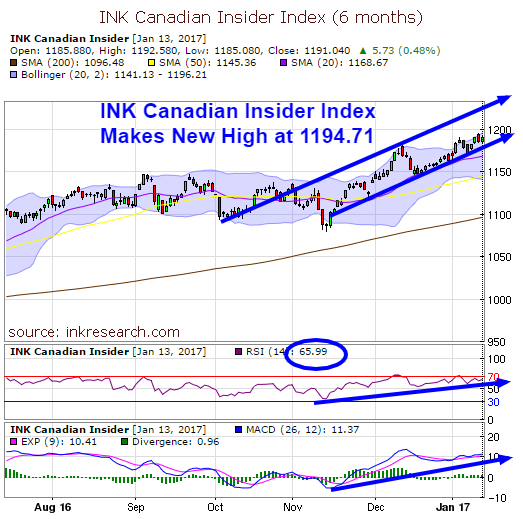
The Index's short-term momentum indicator (RSI) remained robust and rose 0.5 points to 65.45. The Index's MACD indicator also ticked higher, adding 0.7 points to finish the week at 11.37. As mentioned before, if MACD can break out into a trading range above the 10-15 point mark, we could really see the Index take off with some gusto. Over the last month, MACD has indeed looked increasingly bullish and more ready than ever to make a leap to higher ground. Last week, its fast blue line gave us a bullish crossover (above the slow red line) and that technical buy signal remains in place.
The Index's support levels are at 1169 (its 20-day simple moving average) and 1180, while 1200 provides overhead resistance.
The Index appears to be biding its time, quietly building up a head of steam for an assault on the psychologically important 1200 mark, as it hugs the bottom of its rising bottom channel.
Category:
- Please sign in or create an account to leave comments
Please make the indicated changes including the new text: US quotes snapshot data provided by IEX. Additional price data and company information powered by Twelve Data.