
INK Canadian Insider Index: bottomed and ready for blast-off?
Thank you for joining us in a weekly technical look at the mid-cap oriented INK Canadian Insider (CIN) Index. The Index continues to show signs of emerging from its recent slumber, and, indeed, last week bounded as high as 1201 where its upper Bollinger bands kept it in check. And though The INK CIN dipped slightly on Thursday and Friday, it managed to avoid even a single touch of its 50-day moving average (1181) the entire stretch and managed to add 6 points.
Our short-term momentum indicator, RSI, rose nearly 4 points to close above the key 50-point level at 51.48, providing further bullish confirmation. No one wants to declare victory prematurely in the often humbling game of market prediction, but last week's sub-40 RSI reading does look increasingly like a bottom for the Index as we suggested: having only occurred on a handful of occasions since the Fall of 2016, each time marking a major bottom.
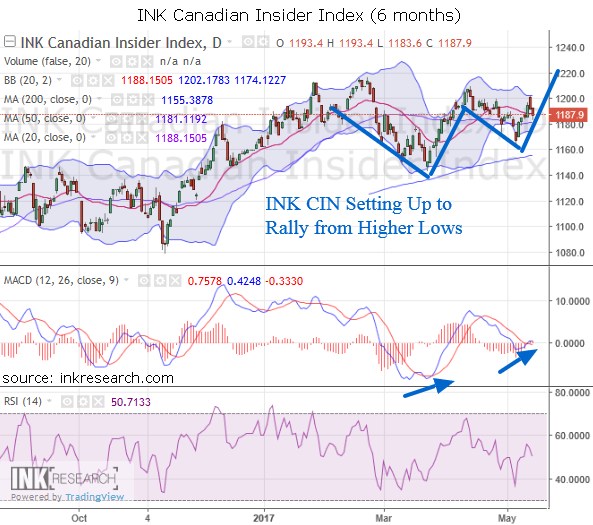
The longer-term momentum indicator MACD dipped about 1.5 points to -0.33. However, MACD is now setting up in a potentially bullish configuration at the bottom of its channel with lots of room to rise. What's more, the week's action generated a bullish crossover of the fast indicator, giving us a technical buy signal.
Resistance remains in place at 1200 and 1190. On the other hand, support sits at 1181 (the Index's 50-day moving average) and 1174.5 at its lower Bollinger band.
We suggested that the Index's piercing of the lower Bollinger band and subsequent reversal two weeks ago was extremely bullish and compared it to identical behaviour when the INK CIN bottomed in November. That was right before the Index turned on the afterburners and rocketed 12% in just 10 weeks. What's more, the Index's higher low this month has its chart looking more and more bullish.
And as we've outlined above, we are seeing increasingly more confirmations of a bottom and an imminent rally.
Category:
- Please sign in or create an account to leave comments
Please make the indicated changes including the new text: US quotes snapshot data provided by IEX. Additional price data and company information powered by Twelve Data.