
INK Canadian Insider Index adds 6.9 points, finishes at 1099.71
Thank you for joining us in a weekly technical look at the mid-cap oriented INK Canadian Insider (CIN) Index. The INK CIN rose for the second week in a row, gaining 6.9 points or 0.6% to finish at 1099.71.
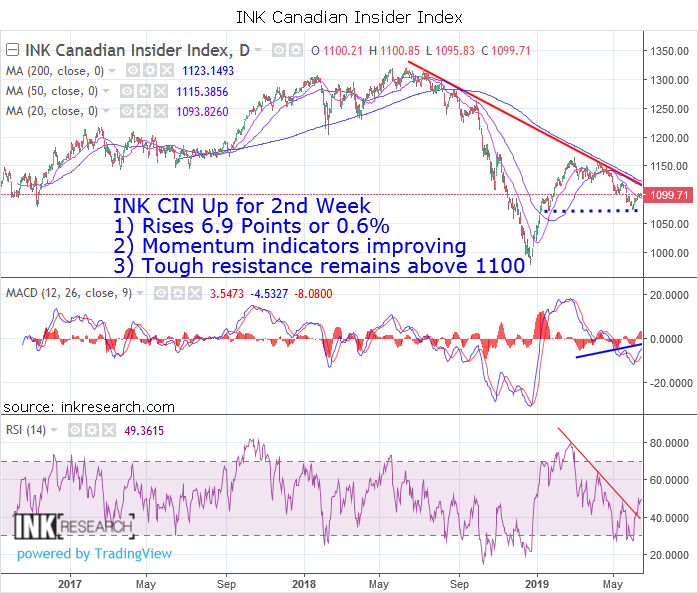
MACD increased 2 points to 3.55. Our short-term momentum indicator RSI jumped 6.8 points to 49.36. RSI broke up through a downward trend that dates back to late February. The MACD histogram has a small one-month uptrend in place we will continue to watch.
Support is at 1093.82 (20-day moving average) and 1073.98 (lower Bollinger band). Resistance is at 1100 and 1115.
The INK Canadian Insider Index beat US Markets (+0.5%), copper (+0.08%), gold (-0.12%), and oil (-2.74%) but was off the pace of sharply surging Gold miners (+1.92%).
This week we put up a long-term chart of the Index. It looks constructive in that price remains within striking distance of its 200-day moving average. Of course, the key is the Index must continue to maintain its 1070-area support if it is to have a chance to finally break up and through the tough 1100 level and downward trend (sloping red line) which began around this time last year.
The INK Canadian Insider Index is used by the Horizons Cdn Insider Index ETF (HII), a 2017 and 2018 Fundata Fundgrade A+ ® award winner.
Category:
Please make the indicated changes including the new text: US quotes snapshot data provided by IEX. Additional price data and company information powered by Twelve Data.