
A double bottom for the INK Canadian Insider Index?
Technical Overview by Nicholas Winton, Hedgehog Trader and @HedgehogTrader on Twitter
Thank you for joining us in a weekly technical look at the mid-cap oriented INK Canadian Insider (CIN) Index. The Index pulled back steeply to the 900 level, which we've been noting as a key support, before closing last week at 921.70. While its initial momentum has definitely dissipated with a drop of nearly 3% since our last update, a pullback to 900 was not unexpected as a re-test is often required before we can see an advance play out.
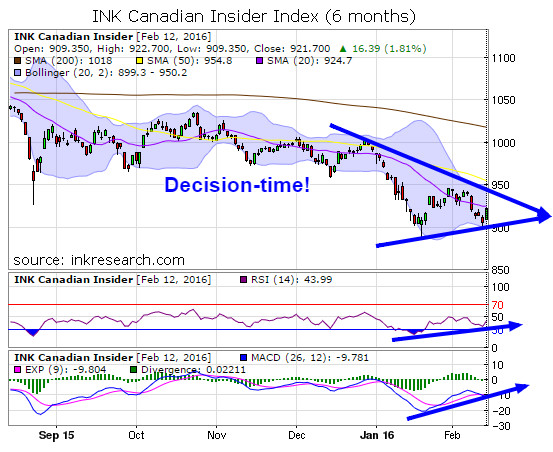
The trendlines as illustrated on our chart are converging and it seems likely we'll soon have a resolution of a breakout above 950 (which the bull case really needs sooner than later) or a breakdown under 900.
Momentum indicators remain modest with RSI capped under the 50 level for the last 6 weeks, though we note it has embarked on a mild uptrend since it bottomed in January. The slower moving momentum indicator MACD is also moving in a slight uptrend and finds itself at -9.781. Here we note that MACD hasn't been positive since a brief burst in October.
Since the Index is once again near its lows, we don't have a minor support to report but rather two major supports, the first at 900 and a second major support at 885 where it bottomed in January. The Index is just below minor resistance which is its 20 day moving average, 924.7. Major resistance is 950. At this point, the Index, now just 4% above its lows, is drifting more than anything, in a tight range of between 900-950 and is in wait of a catalyst. In order for a double bottom to be in place, we will need to see momentum pick up in a big way.
Category:
- Please sign in or create an account to leave comments
Please make the indicated changes including the new text: US quotes snapshot data provided by IEX. Additional price data and company information powered by Twelve Data.