
Does this indicator hold a bullish hint for INK Canadian Insider Index?
Thank you for joining us in a weekly technical look at the mid-cap oriented INK Canadian Insider (CIN) Index. Last week, the Index had a fairly calm week, without much in the way of volatility, closing down 10 points at 1127.38.
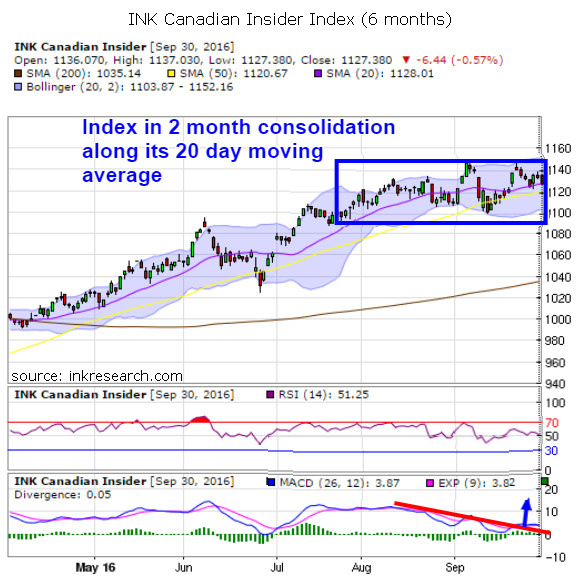
Our short term momentum indicator RSI dipped 6 points but held onto its key 50-point plateau, closing at 51.25.
Our long-term momentum indicator MACD dipped a nearly imperceptible 0.35 points. But what has me interested in the MACD chart for the first time in a long time, is that MACD is close to breaking out of a long term downtrend which began in early July. Its fast blue line remains above the slow red line. These two bullish factors enhance the prospect that the Index's tight-ranged two-month sideways consolidation may be about to end and that momentum may be ready to shift on over to the bull side.
Indeed, should we observe a couple more weeks of strengthening of our MACD indicator, it would add to the likelihood that MACD our long-term momentum indicator is readying for a significant and persistent trend change and rise - which would naturally be very bullish for the Index.
Support lies at 1121 (the 20-day simple moving average) and 1128. Resistance is at 1135 and 1140.
Category:
- Please sign in or create an account to leave comments
Please make the indicated changes including the new text: US quotes snapshot data provided by IEX. Additional price data and company information powered by Twelve Data.