
Dives and divergence: the INK Canadian Insider Index drops 2.8%
Thank you for joining us in a weekly technical look at the mid-cap oriented INK Canadian Insider (CIN) Index. The INK CIN Index tumbled yet again last week, shedding 32.65 points or 2.8%. The Index has now endured a nearly vertical correction of over 9% these past four weeks.
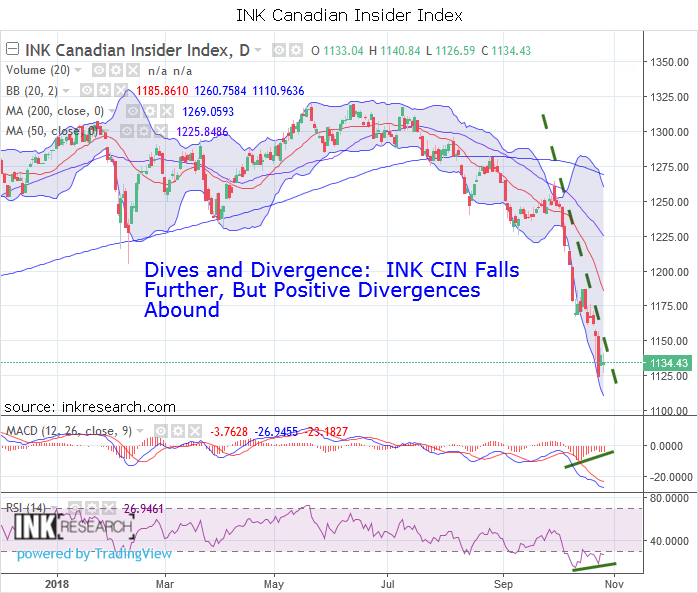
Interestingly, our long-term momentum indicator MACD rose for the second time in two weeks, climbing from -4.2 to -3.76. Our short-term momentum indicator RSI pulled back slightly from 28.10 to 26.94 but held well above the recent low of 20.70. As far as potential for the INK CIN Index's losing streak to end, bullish divergences are appearing. MACD histogram has been trending higher as has RSI (see green lines moving from lower left to upper right). These divergences are not an instantaneous turn signal (indeed, we began to see some of these a week ago), but they often provide an early indication of an impending reversal and coming rally.
Support moves back to 1100 and 1120. Resistance is now at 1140 and 1150.
While the Index is displaying these momentum divergences, what's even more bullish is we are also seeing similar technical action across major US Indices, world stock markets, commodities (like copper), and even on The Venture (CDNX). A broad-based reversal could indeed be in the cards. For now, just when market sentiment is extremely pessimistic, we are about to enter a seasonal period where the US market typically performs extremely well into year end. My thought is we finally see a good-sized market bounce within the next week or so, followed by a retest, and a further rally post-US midterm elections. This coming relief bounce should be beneficial to the INK CIN Index (which has corrected at what appears to be an unsustainable degree) and stocks in general.
Category:
- Please sign in or create an account to leave comments
Please make the indicated changes including the new text: US quotes snapshot data provided by IEX. Additional price data and company information powered by Twelve Data.